YEAR-OVER-YEAR STATS (June 2026 Vs June 2025)
CLOSED SALES – There were 1,920 closed sales in June, UP+13.2% from June of 2025.
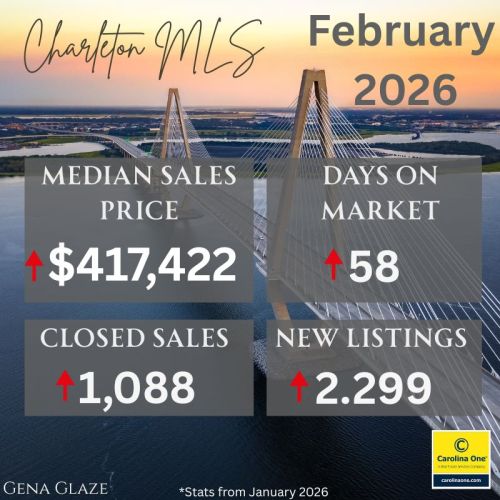
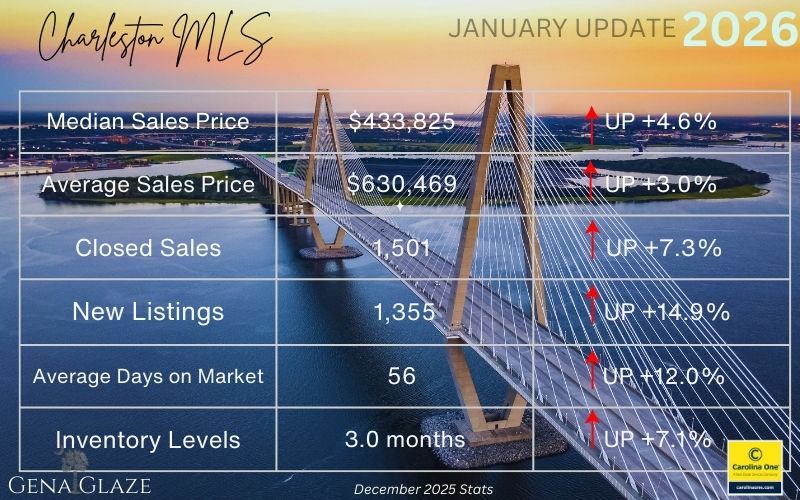
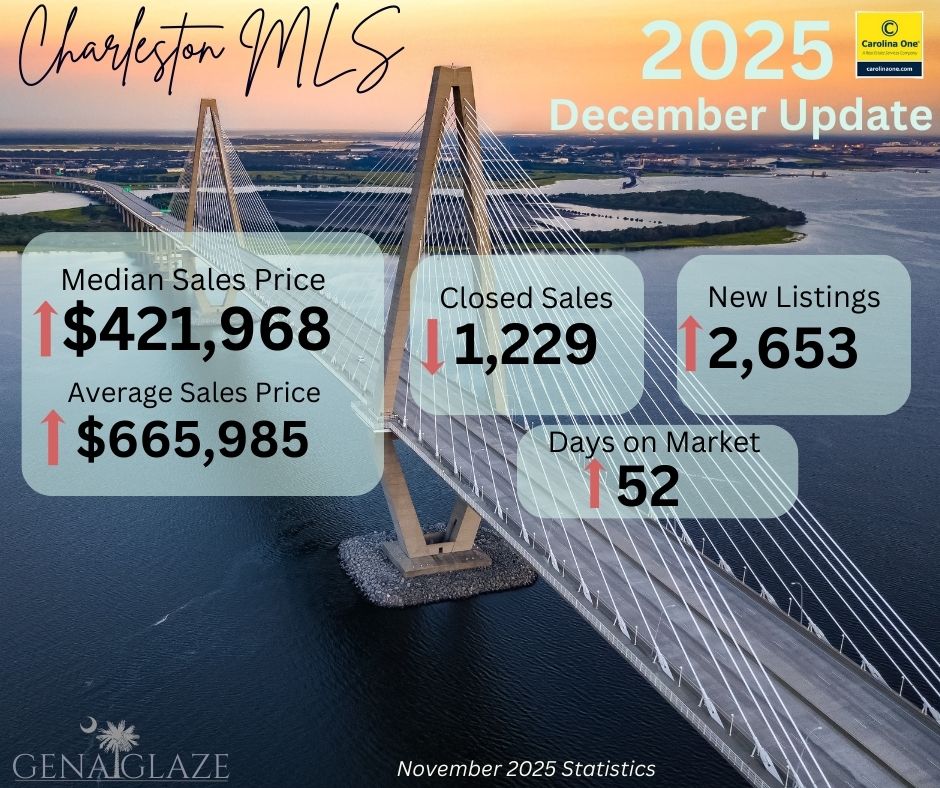
SALES PRICE – The median sales price closed out at $460,000, UP +7.0% from June 2025, and the average sales price for June was $743,583 UP +18.7%
INVENTORY – Approximately 2,314 new listings (all property types) came online in June of 2026, which is UP +2.2%. The average Days on Market was at 21, year-over-year, with 3.4 months of inventory
PRICE PER SQFT – The average price per sqft for all residential property types was at $241, UP +4.3%
NEW WRITTEN SALES (Pending) – There were 1,870 new written sales in June 2026, UP +16.7% This is an indicator of future closed sales.
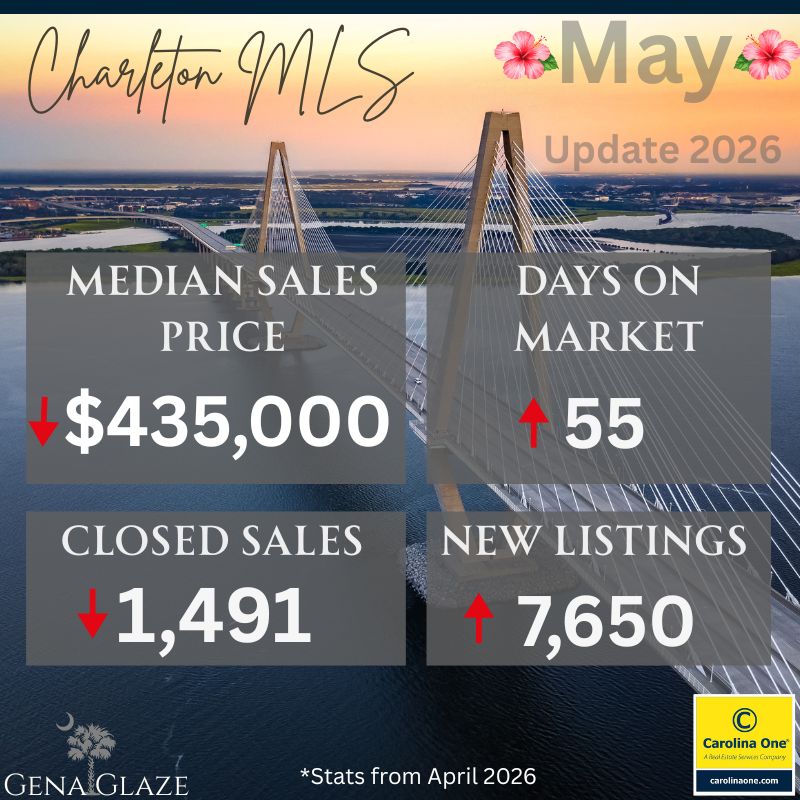
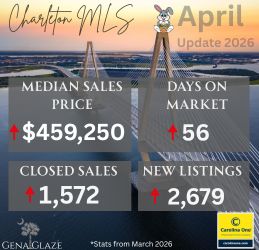
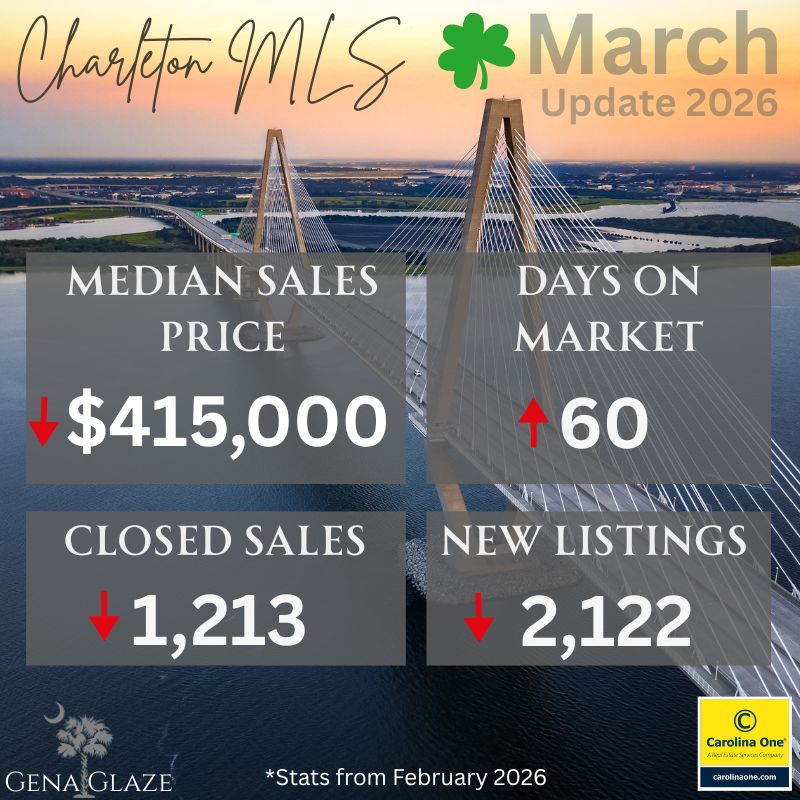
For the majority of the last three years, the Charleston market has seen median sale price fluctuate within a narrow range of $400k to $430k. There was a brief surge in April of this year when the median price reached $459k. This shift was short-lived and prices quickly reverted back toward to the established trend. However, we just hit another high in June of $460K. It remains to be seen whether this marks the beginning of a new trajectory or simply reflects seasonal volatility driven by inventory constraints. It seems
The summer market continues to be strong with a 16.7% (year-over-year) increase of new contracts being written – An indicator of future closed sales. Inventory is still below the ideal for a balanced market at 3.5 months. New listings have been steadily coming online but more inventory is needed to balance the market.
NEW CONSTRUCTION
New construction represented approximately 22% of all closings in MLS.
- 12% of all closings in Charleston County are new construction
- 26% of all closings in Dorchester County were new construction
- 36% of all closings in Berkeley County were new construction
May MEDIAN SALES PRICE BY COUNTY:
Berkeley County – $399,900
Dorchester County – $387,758
Charleston County – $668,250
Real Estate is Hyper Local. Market statistics vary by location, if you would like a detailed report of your neighborhood and home’s value, feel free to contact me.