Category Archives: Market Statistics

Market Review – Charleston Area MLS -JULY 2026

YEAR-OVER-YEAR STATS (June 2026 Vs June 2025)

CLOSED SALES – There were 1,920 closed sales in June, UP+13.2% from June of 2025.


SALES PRICE – The median sales price closed out at $460,000, UP +7.0% from June 2025, and the average sales price for June was $743,583 UP +18.7%

INVENTORY – Approximately 2,314 new listings (all property types) came online in June of 2026, which is UP +2.2%. The average Days on Market was at 21, year-over-year, with 3.4 months of inventory

PRICE PER SQFT – The average price per sqft for all residential property types was at $241, UP +4.3%

NEW WRITTEN SALES (Pending) – There were 1,870 new written sales in June 2026, UP +16.7% This is an indicator of future closed sales.

For the majority of the last three years, the Charleston market has seen median sale price fluctuate within a narrow range of $400k to $430k. There was a brief surge in April of this year when the median price reached $459k. This shift was short-lived and prices quickly reverted back toward to the established trend. However, we just hit another high in June of $460K. It remains to be seen whether this marks the beginning of a new trajectory or simply reflects seasonal volatility driven by inventory constraints. It seems

The summer market continues to be strong with a 16.7% (year-over-year) increase of new contracts being written – An indicator of future closed sales. Inventory is still below the ideal for a balanced market at 3.5 months. New listings have been steadily coming online but more inventory is needed to balance the market.

NEW CONSTRUCTION

New construction represented approximately 22% of all closings in MLS.

  • 12% of all closings in Charleston County are new construction
  • 26% of all closings in Dorchester County were new construction
  • 36% of all closings in Berkeley County were new construction

May MEDIAN SALES PRICE BY COUNTY:

Berkeley County  – $399,900

Dorchester County – $387,758

Charleston County – $668,250

Real Estate is Hyper Local. Market statistics vary by location, if you would like a detailed report of your neighborhood and home’s value, feel free to contact me.

Gena Glaze

Leave a comment

Filed under Charleston SC Market Stats, Market Statistics, Real Estate (Market info)

Market Review – Charleston Area MLS -JUNE 2026

YEAR-OVER-YEAR STATS

CLOSED SALES – There were 1,881 closed sales in May, up +3.1% from May of 2025.


SALES PRICE – The median sales price closed out at $435,000 up +0.4% from May 2025, and the average sales price for May was $680,138

INVENTORY – Approximately 2,633 new listings (all property types) came online in May of 2026, which is up up +7.5%. The average Days on Market was at 48, year-over-year, with 3.6 months of inventory

PRICE PER SQFT – The average price per sqft for all residential property types was at $232 | down -1.3%

NEW WRITTEN SALES (Pending) – There were 1,921 new written sales in May 2026, up +15.2% This is an indicator of future closed sales.

For the majority of the last three years, the Charleston market has seen median sale price fluctuate within a narrow range of $400k to $430k. Although there was a brief surge in April of this year when the median price reached $459k, it has recently retreated to align more closely with established trends. The summer market continues to be strong with a 15.2% (year-over-year) increase of new contracts being written. Inventory is still below the ideal for a balanced market at 3.6 months, but new listings are steadily coming online and surpassing the monthly totals from a year ago. It will take some time to build the inventory levels.

NEW CONSTRUCTION

New construction represented approximately 26% of all closings in MLS.

  • 12% of all closings in Charleston County are new construction
  • 38% of all closings in Dorchester County were new construction
  • 37% of all closings in Berkeley County were new construction

May MEDIAN SALES PRICE BY COUNTY:

Berkeley County  – $414,250

Dorchester County – $399,900

Charleston County – $519,900

Real Estate is Hyper Local. Market statistics vary by location, if you would like a detailed report of your neighborhood and home’s value, feel free to contact me.
Gena Glaze

Leave a comment

Filed under Charleston SC Market Stats, Market Statistics, Real Estate (Market info)

Market Review – Charleston Area MLS -MAY 2026

YEAR OVER YEAR

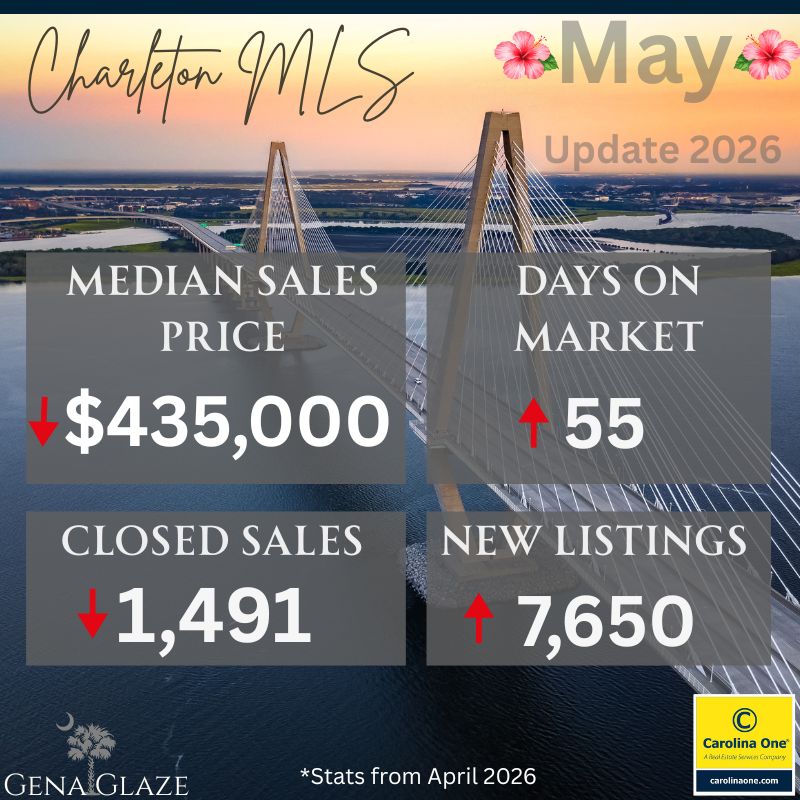
CLOSED SALES – There were 1,491 closed sales in April of 2026, down -6.3 from April of 2025


SALES PRICE – The median sales price closed out at $435,000 down – 1.1% year-over-year, and the average sales price for April 2026 was $656,619.

The median sale price in the Charleston market surged to a record high in March, jumping to $459k. This is well outside the tight band between $400k and $430k where the median sales price had remained for past 3+ years. This surprise was just one month’s data; April’s median sales price of 435K was back closer to the trend.

PRICE PER SQFT – The average price per sqft for all residential property types was at $313 Up +2.3%

NEW WRITTEN SALES (Pending) – There were 5,732 new written sales in April 2026, up +13.7% This is an indicator of future closed sales.

INVENTORY – Approximately 7,650 new listings (all property types) came online in April of 2026, which is up 5.8%. The average Days on Market was at 55, up +5.8% with 3.4 months of inventory.

NEW CONSTRUCTION

New construction represented approximately 25% of all closings in MLS.

  • 18% of all closings in Charleston County are new construction
  • 19% of all closings in Dorchester County were new construction
  • 39% of all closings in Berkeley County were new construction

APRIL MEDIAN SALES PRICE BY COUNTY:

Berkeley County   $434,205 | up +8.4%

Dorchester County
$389,110 | Down-2.1%

Charleston County
$572,400 | Down -10.7%

Real Estate is Hyper Local. Market statistics vary by location, if you would like a detailed report of your neighborhood and home’s value, feel free to contact me.
Gena Glaze

Leave a comment

Filed under Charleston SC Market Stats, Market Statistics, Real Estate (Market info)

Market Review – Charleston Area MLS -APRIL 2026

YEAR OVER YEAR

CLOSED SALES – There were 1,572 closed sales in March of 2026, up 2% from March of 2025


SALES PRICE – The median sales price closed out at $459,250 Up 8.1% year-over-year, and the average sales price for March 2026 was $747,843

PRICE PER SQFT – The average price per sqft for all residential property types was at $330 Up +7.1%

NEW WRITTEN SALES (Pending) – There were 2,166 new written sales in March 2026, up +20.3% This is an indicator of future closed sales.

INVENTORY – Approximately 2,679 new listings (all property types) came online in March of 2026, which is up 8.5%. The average Days on Market was at 56, up + 7.7% with 3.3 months of inventory.

NEW CONSTRUCTION

New construction represented approximately 30% of all closings in MLS.

  • 18% of all closings in Charleston County are new construction
  • 31% of all closings in Dorchester County were new construction
  • 45% of all closings in Berkeley County were new construction

FEBRUARY MEDIAN SALES PRICE BY COUNTY:

Berkeley County  
$425,000- Up +9.7%

Dorchester County
$371,300 – Down -1.0%

Charleston County
$687,000 Up +5.7%

Real Estate is Hyper Local. Market statistics vary by location, if you would like a detailed report of your neighborhood and home’s value, feel free to contact me.
Gena Glaze

Leave a comment

Filed under Charleston SC Market Stats, Market Statistics, Real Estate (Market info)

Market Review – Charleston Area MLS -March Update 2026

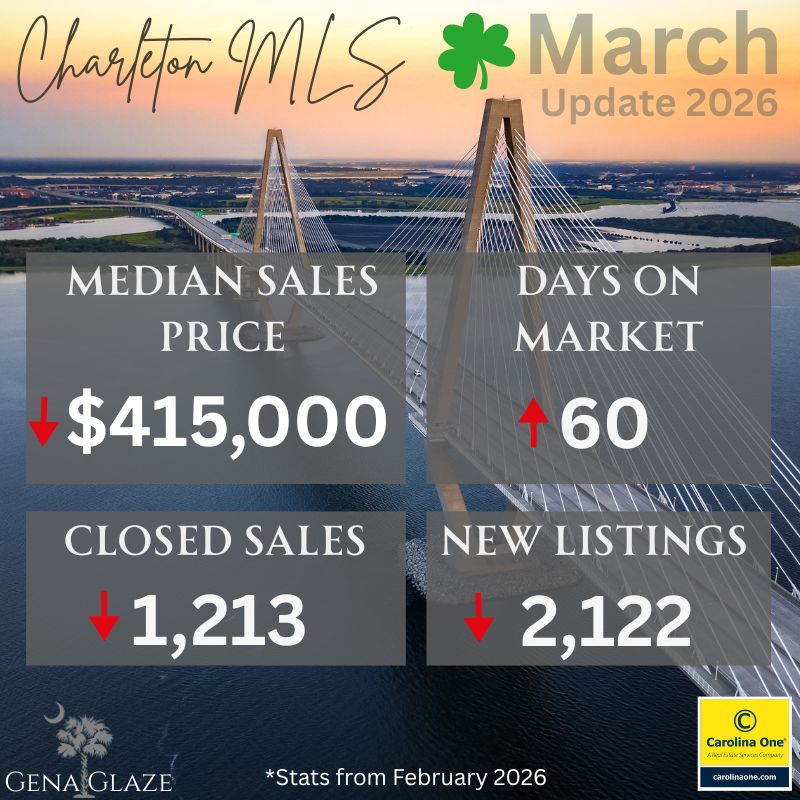
CLOSED SALES – There were1,213 closed sales in February of 2026, down 4.6% from February of 2025


SALES PRICE – The median sales price closed out at $415,000 down -0.8% year-over-year, and the average sales price for February 2026 was $655,150.

PRICE PER SQFT – The average price per sqft for all residential property types was at $301 | up +1.7%

NEW WRITTEN SALES (Pending) – There were 1,592 new written sales in February 2026, up +7.6% This is an indicator of future closed sales.

INVENTORY – Approximately 2,122 new listings (all property types) came online in February of 2026, which is down 0.2%. The average Days on Market was at 60, up +1.7% with 3.3 months of inventory.

NEW CONSTRUCTION

New construction represents 31% of all closings in MLS.

  • 18% of all closings in Charleston County are new construction
  • 24% of all closings in Dorchester County are new construction
  • 52% of all closings in Berkeley County are new construction

FEBRUARY MEDIAN SALES PRICE BY COUNTY:

Berkeley County  
$392,700 – Down -0.1%

Dorchester County
$363,208 – Up +0.9%

Charleston County
$606,250 Down -5.3%

Real Estate is Hyper Local. Market statistics vary by location, if you would like a detailed report of your neighborhood and home’s value, feel free to contact me.
Gena Glaze

Leave a comment

Filed under Charleston SC Market Stats, Market Statistics, Real Estate (Market info)

Market Review – Charleston Area MLS -February Update 2026

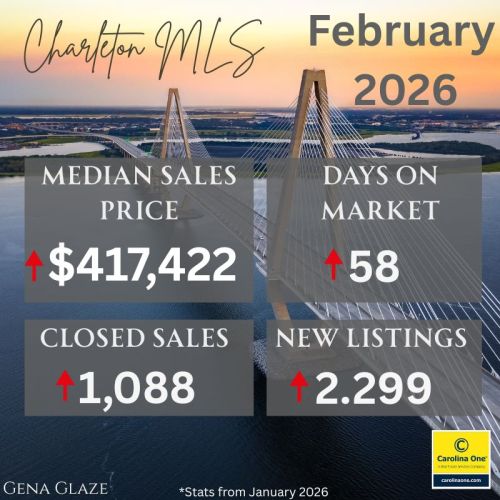
CLOSED SALES – There were1,088 closed sales in January of 2026, up 3.2.% from January of 2025

SALES PRICE – The median sales price closed out at $417,422 up +0.3% year-over-year, and the average sales price for January 2026 was $707,670

PRICE PER SQFT – The average price per sqft for all residential property types was at $311 | up +4.7%

NEW WRITTEN SALES (Pending) – There were 1,536 new written sales in January 2026, up + 17.8% This is an indicator of future closed sales – a good start for 2026!

INVENTORY – Approximately 2,299 new listings (all property types) came online in January of 2026, which is upc+19.2% with the average Days on Market at 58, up +16% and 3.2 months of inventory.

NEW CONSTRUCTION

New construction represents 40% of all pending contracts in the MLS and new construction comprises about 34% of the closings.

  • 14% of all closings in Charleston County are new construction
  • 38% of all closings in Dorchester County are new construction
  • 53% of all closings in Berkeley County are new construction

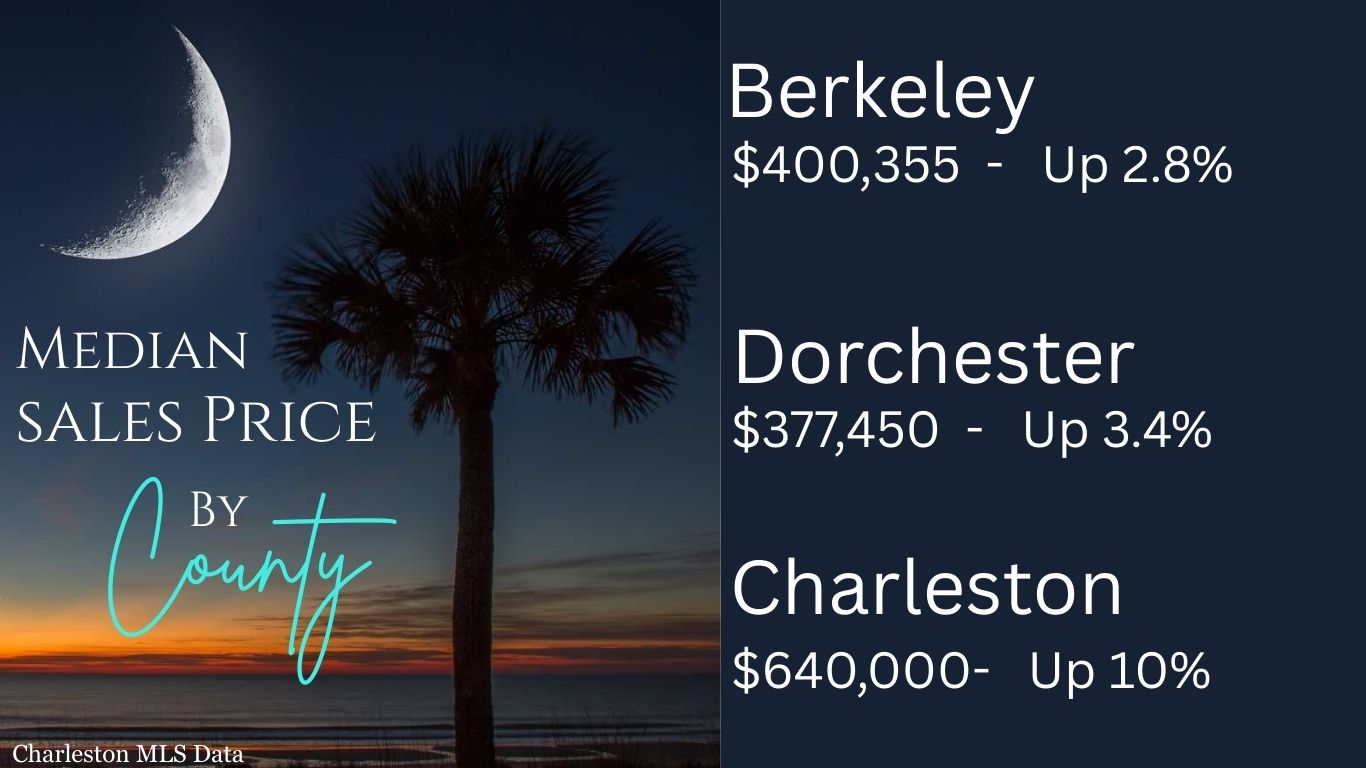
JANUARY MEDIAN SALES PRICE BY COUNTY:

Berkeley County  
$395,000 – Up +1.5%

Dorchester County
$367,500 – Down -3.3%

Charleston County
$665,000 – Up +10.8%

Real Estate is Hyper Local. Market statistics vary by location, if you would like a detailed report of your neighborhood and home’s value, feel free to contact me.
Gena Glaze

Leave a comment

Filed under Charleston SC Market Stats, Market Statistics, Real Estate (Market info)

Market Review – Charleston Area MLS -January Update 2026

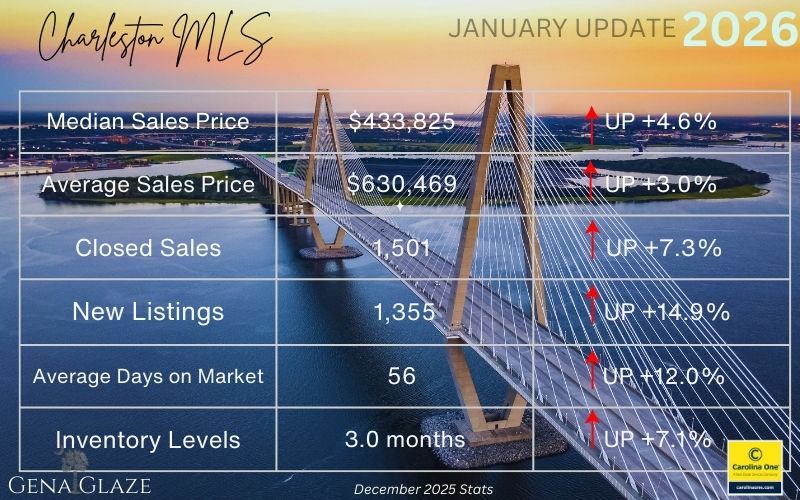
CLOSED SALES – There were1,501 closed sales in December of 2025, up 4.6% from December of of 2025

SALES PRICE – The median sales price closed out at $433,825| up+4.6% year-over-year, and the average sales price for November 2025 was$630,469 up+3.0%

PRICE PER SQFT – The average price per sqft for all residential property types was at $295 | up +1.4%

NEW WRITTEN SALES (Pending) – There were 1,181 new written sales in December 2025, up+16.2% This is an indicator of future activity and seems to be a good sign for 2026.

INVENTORY – Approximately 1,355 new listings (all property types) came online in December of 2025, which is upc+14.4% with the average Days on Market at 56, up +12% and 3.0 months of inventory.

NEW CONSTRUCTION

new construction comprises about 34% of the closed sales and represents 37% of all pending contracts in the MLS

  • New Homes “pendings” will always be higher than new homes closings as new construction typically sits in pending status for far longer than a resale, and the new homes tend to “pile up” in pending status, so new homes actually represent about 34% of the sales market currently
  • New homes represent 24% of the available inventory currently
  • 14% of all closings in Charleston County are new construction
  • 38% of all closings in Dorchester County are new construction
  • 53% of all closings in Berkeley County are new construction

DECEMBER MEDIAN SALES PRICE BY COUNTY:

Year over Year – 2024 VS 2025

Nationally– Year Over Year – There was 3.0% decrease in pending home sales according to the National Association of Realtors. Regionally, there were gains in in the South and declines in the Northeast, Midwest, and West

Charleston MLS – 2025 Closed sales were at approximately 5,000 which was about the same as they were in 2024. New listing total for the year came in at 6,012, up just 1% from 2024 and the median sales price was up just 1.3 %.

The Takeaway: December 2025 saw some increases in closed sales, price, and inventory compared to December 2024, but the year-over-year comparison (2024/2025) was relatively flat, with 2025 statistics very similar to those of 2024. However, December 2025 experienced an impressive 16% increase in Pending Sales (new written sales/not closed), which is an indicator of future closed sales and could be a positive sign for 2026.

Gena Glaze

Leave a comment

Filed under Charleston SC Market Stats, Market Statistics, Real Estate (Market info)

Market Review – Charleston Area MLS – December Update 2025

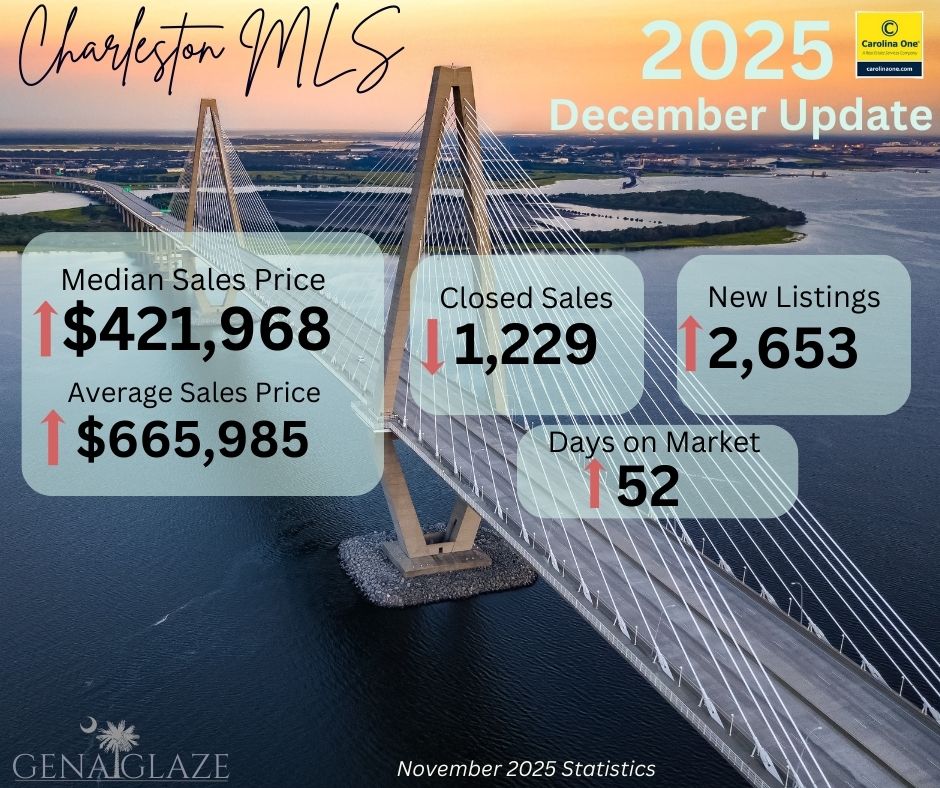
CLOSED SALES – There were1,229 closed sales in November of 2025, down-7.8% from November of 2024.

SALES PRICE – The median sales price closed out at $421,968 | up+0.6% year-over-year, and the average sales price for November 2025 was$665,985 | up+8.8%

PRICE PER SQFT – The average price per sqft for all residential property types was at $228 | up +3.2%

NEW WRITTEN SALES (Pending) – There were 1,286 new written sales in November 2025, up+4.0%

INVENTORY – Approximately 2,653 new listings (all property types) came online in November of 2025, which is up+4.4% with the average Days on Market at 52, up +8.3% and 3.5 months of inventory.

NEW CONSTRUCTION

  • New homes represent 28% of closed sales, which is down approximately 26%

The Takeaway: Closed sales dipped slightly, but with mortgage rates easing, more buyers are jumping back in, as seen in the rise in loan applications and new sales contracts. New listings climbed about 4%, adding to inventory and lengthening days on market, though we’re still short of the supply needed for a balanced market.

OCTOBER MEDIAN SALES PRICE BY COUNTY:

Berkeley $380,000 | down-4.0%

Dorchester $385,000 | up+4.1%

Charleston $636,000 | down-2.2%

Gena Glaze

Leave a comment

Filed under Charleston SC Market Stats, Market Statistics, Real Estate (Market info)

Charleston was Listed as One of the Top 10 Homebuying Hotspots for 2026 by The National Association of Realtors

The National Association of REALTORS® unveiled the top 10 homebuying hot spots for 2026 in a new report, Housing Hot Spots for 2026: The Markets Poised for New Buyer Opportunities. Charleston was among the selected. 
These top 10 housing hot spots consist of markets that outperform the average market in the U.S. on at least five of 10 economic, demographic, and housing indicators, have populations above 250,000, and demonstrate meaningful 2026 opportunities for homebuyers.


NAR senior economist Nadia Evangelou stated that, “Charleston is a metro that stands out from the crowd”. The city’s inventory is growing at the right price points, offering would-be buyers’ greater affordability than many other locations.

Population growth in the metro remains among the fastest in the area, fueled by both millennial households and high-income transplants from the Northeast. Additionally, income growth in Charleston is 6% year over year, while job growth is up 3.2% compared to 2024.

Read More

Gena Glaze

Leave a comment

Filed under Charleston Area Growth and Development, Charleston SC Market Stats, Home Buying (For Buyers), Market Statistics

Market Review – Charleston Area MLS – November Update 2025

CLOSED SALES – There were1,379 closed sales in October of 2025, up 0.9% from October of 2024.

SALES PRICE – The median sales price closed out at $425,885 | up+2.0% year-over-year, and the average sales price for October 2025 was$653,949 | up +1.3%

PRICE PER SQFT – The average price per sqft for all residential property types was at $292, down -3.3%

NEW WRITTEN SALES (Pending) – There were 1,580 new written sales in October 2025, up +2%

INVENTORY – Approximately 2,134 | listings (all property types) came online in October of 2025, which is up+8.5% and the average Days on Market was at 54, up +22.7% with 3.2 months of inventory.

NEW CONSTRUCTION

  • New homes represent 37% of closed sales
  • 18% of all closings in Charleston County were new construction
  • 35% of all closings in Dorchester County were new construction
  • 53% of all closings in Berkeley County were new construction

OCTOBER MEDIAN SALES PRICE BY COUNTY:

Berkeley $402,900 | up +6.0%

Dorchester $370,000 | up +1.3%

Charleston $685,000 | up+11.4%

Gena Glaze

Leave a comment

Filed under Charleston SC Market Stats, Market Statistics, Real Estate (Market info)