A CL100 refers to a specialized inspection completed by a licensed pest control company and documented on the Clemson form 100. It is the official Wood Infestation Report for South Carolina. The reports are only valid for 30 days and are a common inspection performed in a real estate transaction.
The Department of Pesticide Regulations at Clemson University is the enforcement and investigative authority in the state of South Carolina for pesticide use, alleged pesticide misuse, sub-standard termite treatments, and wood infestation reports.
A Wood Infestation Report is a report of visible infestation of damage caused by insects (e.g., termites and beetles) and active wood destroying fungi / decay (moisture damage) in accessible areas of the structure, with the inspection for decay fungi usually limited to the portion of the structure below the level of the first main floor.
The CL100 is often referred to as “The Termite Inspection” but the inspection includes more than an inspection of active termites, it also details previous termite damage and other types of wood-destroying organisms and moisture conditions.
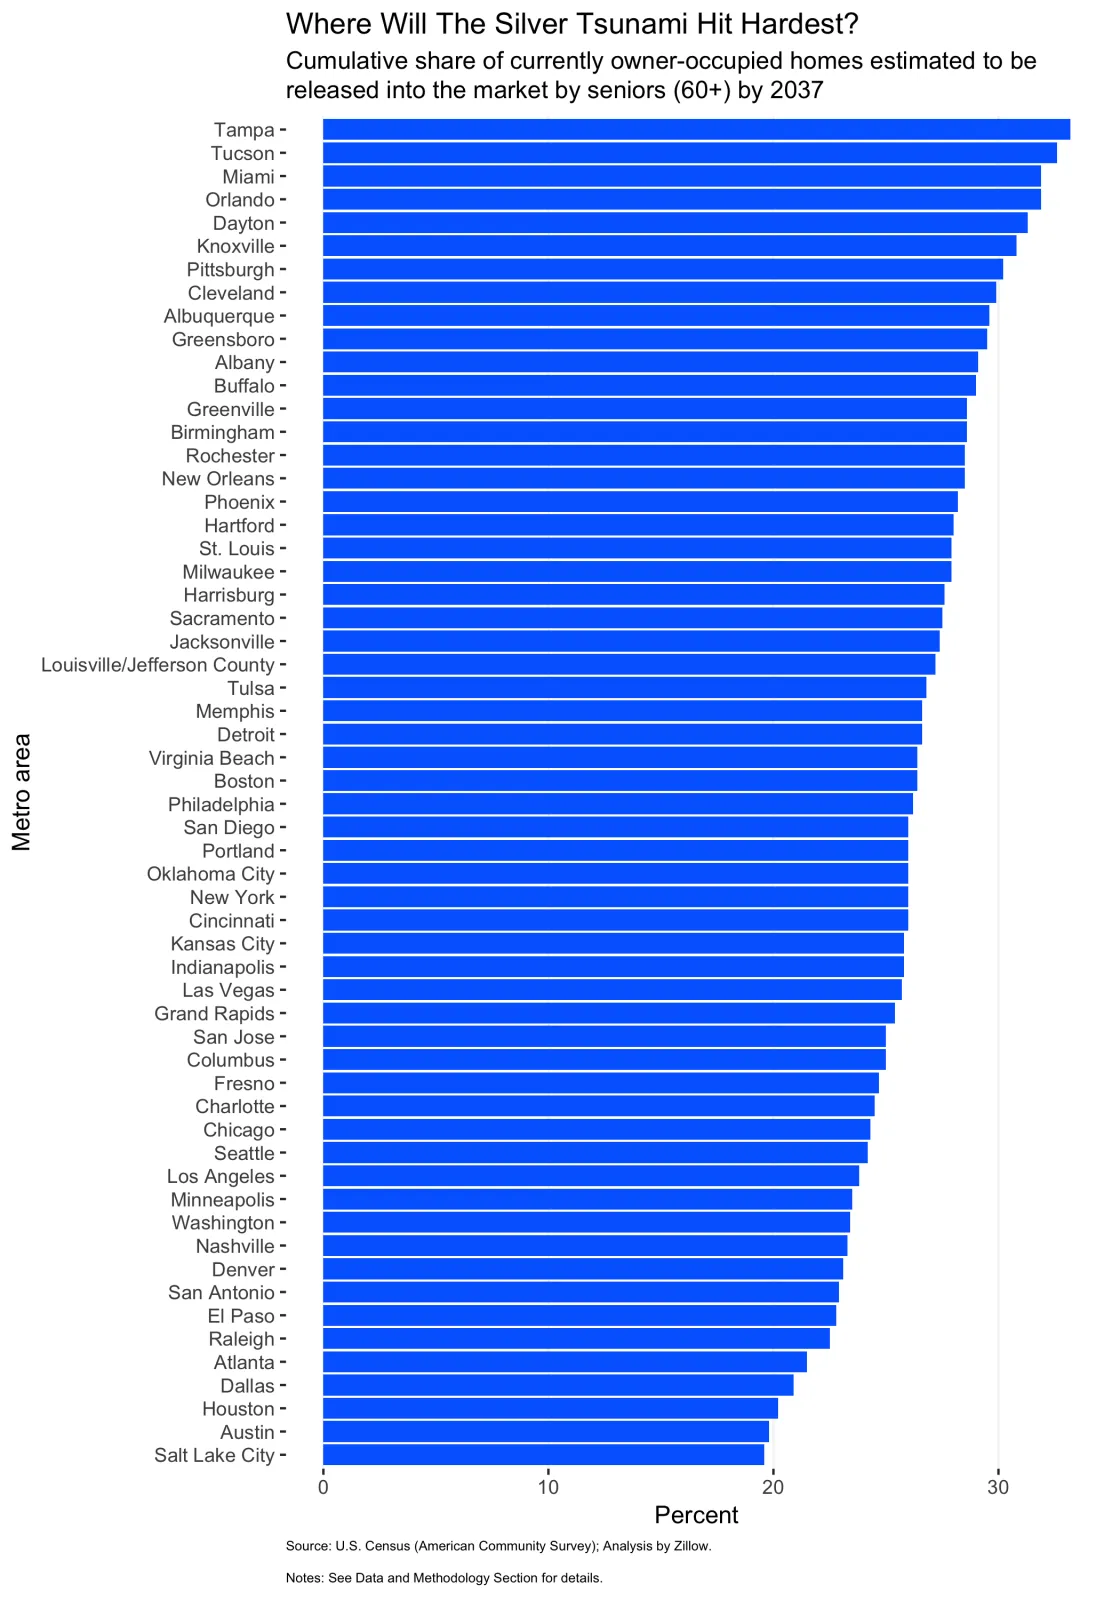
Zillow reports that over the next 20 years, more than a quarter (27.4 percent) of the nation’s currently owner-occupied homes are likely to hit the market as their current owners pass away or otherwise vacate their homes.
Places likely to be most impacted by this upcoming Silver Tsunami include both retirement hubs (Miami, Orlando, Tampa and Tucson) and regions where young residents have left (Cleveland, Dayton, Knoxville and Pittsburgh). The impact of the Silver Tsunami is also likely to vary greatly across different areas within metros.
Housing released by the Silver Tsunami will provide a substantial and sustained boost to housing supply, comparable in magnitude to the fluctuations that new home construction experienced in the 2000s boom-bust cycle.
It seems likely that, in the coming two decades, the construction industry will need to place a greater focus on updating existing properties, in addition to simply building new homes.
The massive Baby Boomer generation has already begun aging into retirement, and will begin passing away in large numbers in coming decades – releasing a flood of currently owner-occupied homes that could hit the market. That could help end the last few years’ inventory drought, as well as a more fundamental shortage of homes in certain places.
This Silver Tsunami of homes coming to market could be a good substitute for new home construction, which has been in short supply for the past decade in large part because of difficult-to-overcome challenges faced by builders.
Currently, 33.9 percent of owner-occupied U.S. homes are owned by residents aged 60 or older, and 55.2 percent by residents aged 50 or older. As these households age and begin vacating housing, that could represent upwards of 20 million homes hitting the market through the mid-2030s.
But while virtually all areas will feel the effects to some degree, this wave won’t hit all at once and won’t strike all markets equally. Certain markets will be more impacted than others, as will certain kinds of areas within a given market.
The median sales price in the Charleston market for November 2023 was $399,408, down just 0.15% from November 2022. The average days on market for November 2023 was 38 with approximately 2.32 months of inventory.
Mortgage rates dropped significantly in the last few weeks.
The 30-year, fixed mortgage rate averaged 7.29% for the week ending Nov. 22, according to Freddie Mac‘s Primary Mortgage Market Survey. That’s down significantly from last week’s 7.44% and up from 6.58% the same week a year ago.
HousingWire’s Mortgage Rates Center showed Optimal Blue’s average 30-year fixed rate on conventional loans at 7.283% on Wednesday.
Mortgage applications rose to their highest level in six weeks after the 30-year fixed mortgage rate fell last week.
Mortgage rates for the 30-year fixed loan averaged 7.44%, falling 6 basis points in one week, according to Freddie Mac‘s Primary Mortgage Market Survey.
On a seasonally adjusted basis, purchase applications rose by nearly 4% over the week, with increases in both conventional and government purchase loan demand.
The average loan size on a purchase application was $403,600, the lowest since January 2023. Joel Kan, MBA’s vice president and deputy chief economist, said this corroborates with other sources of home-sales data pointing to a rising share of first-time homebuyers entering the market.
Meanwhile, refinance applications rose slightly by 1.6% last week but remained subdued. The adjustable-rate mortgage (ARM) share of activity fell to 8.3% of total applications, down from 8.8% the previous week.
The share of Federal Housing Administration (FHA) loan activity increased to 14.8% of all applications, down from 14.4% the week prior. The share of Department of Veterans Affairs(VA) loan activity was 11.3%, up from 11.2% over the previous week, while the share of U.S. Department of Agriculture (USDA) loan activity fell to 0.4% from 0.5% week over week.
Home prices in the 20 biggest U.S. metros rose for the sixth month in a row, as the housing market continues to deal with a shortage of homes for sale.
The S&P CoreLogic Case-Shiller 20-city house price index rose 1% in August, as compared with the previous month.
On a year-over-year basis, home prices in the 20 major metro markets in the U.S. were up 2.2% nationally.
A broader measure of home prices, the national index, rose on a month-over-month basis in August by 0.9%, but rose 2.6% over the past year. All numbers are seasonally adjusted.
Key details: Chicago posted the strongest year-over-year home-price gains in the month of August, at 5%. It was the fourth month in a row that the city led the rankings.
New York and Detroit followed, up 4.98% and 4.8% respectively.
The West continued to lag behind the rest of the country: Home prices fell in Las Vegas and Phoenix the most.
Cities
Change from last year
Atlanta
3.4%
Boston
3.1%
Charlotte
3%
Chicago
5%
Cleveland
3.9%
Dallas
-1.7%
Denver
-0.6%
Detroit
4.8%
Las Vegas
-4.9%
Los Angeles
3.2%
Miami
3.3%
Minneapolis
1.9%
New York
5%
Phoenix
-3.9%
Portland
-1.5%
San Diego
4.1%
San Francisco
-2.5%
Seattle
-1.5%
Tampa
0%
Washington
3.4%
Composite-20
2.2%
A separate report from the Federal Housing Finance Agency also showed home prices rose in August, up 0.6% from July.
And over the last year, the FHFA index was up 5.6%.
Home prices were the strongest in the Middle Atlantic region, according to the government’s data.
Big picture: With homeowners not keen on selling their homes, the U.S. housing market will continue to face a shortage of homes for sale, and by extension, see home prices rise. Interested buyers continue to converge on limited inventory.
Until supply catches up, barring any major events, we’re not likely to see a big movement in home prices.
What S&P said: “On a year-to-date basis, the National Composite has risen 5.8%, which is well above the median full calendar year increase in more than 35 years of data,” said Craig J. Lazzara, managing director at S&P DJI.
“The year’s increase in mortgage rates has surely suppressed housing demand, but after years of very low rates, it seems to have suppressed supply even more,” he added.
“Unless higher rates or other events lead to general economic weakness, the breadth and strength of this month’s report are consistent with an optimistic view of future results,” Lazzara said.
What are they saying? “Another large gain in house prices in August suggests that the extremely limited supply of existing homes for sale continued to outweigh high mortgage rates,” Thomas Ryan, property economist at Capital Economics, wrote in a note.
“We think monthly gains in house prices will soften over the remainder of the year in response to the rise in mortgage rates to just under 8.0%. But an extreme lack of inventory in the existing homes market means we don’t anticipate any further house price falls,” he added.
Market reaction: Stocks were up in early trading on Tuesday. The yield on the 10-year Treasury note fell below 4.9%.
Nexton, the most innovative and walkable community in South Carolina, received the Grand Aurora Award in the category “Residential Housing Community of the Year – Masterplan,” at the 2023 Southeast Building Conference. The conference was held on July 21 at the Rosen Centre Hotel in Orlando, Fla.
This award is a testament to Nexton’s dedication to providing residents with environments that allow them to inspire, connect and thrive, and we are incredibly proud to be recognized,” says Cassie Cataline, marketing director at Nexton. “As a lifestyle-driven destination, we strive to blend thoughtful design, innovative technology and modern conveniences to attract numerous homebuyers, renters, businesses and visitors each year.”
Established by the Florida Home Builders Association in 1979, the Aurora Awards recognize outstanding projects from across the Southeast during the annual Southeast Building Conference Featuring 60 categories, the Aurora Awards encompass all facets of the residential, commercial and remodeling industries.
A jury of four acclaimed designers and builders met in May 2023 to select winning projects from a competition of nearly 400 entries. The Grand Award is the highest award an entry can receive in each category.
Celebrating the 10th anniversary of the community’s 2013 groundbreaking, Nexton is a lifestyle-driven destination that artfully blends the best of live, work and play by offering conveniences such as state-of-the-art schools, modern infrastructure, 20 miles of trails and 2,000 acres of green space. The community’s four residential neighborhoods include apartments, built-for-rent homes, townhomes and a variety of for-sale single-family homes that cater to first-time buyers, executives and 55+ retirees. Nexton has currently sold over 2,600 homes.
MLS data – Inventory remained low in October with just 2.13 months of inventory and the median sales price continues on a similar track at just over 400k,
Median Sale Price for October 2023 was $407,093, YTD – $404,981 Absorption Rate – 2.13 (Months of Inventory) YTD – 1.9 Median Days on Market was 15
Written sales market wide in September 2023 finished 6% below September of ‘2022.
Based on interest rates remaining higher, it is anticipated that the second half of the year will be similar to the first half of the year with sales in the -15% year-over-year range
Carolina One finished the month with written sales 21 points OVER the market.
Last week saw 266 properties go under contract, a “normal” number for this time of year but far below the pandemic years of 2020 and 2021. See chart Below – Sales (green line) still remain remarkably close to the 15 year average (blue line) and have for about three and a half months. The orange line represents ratified contracts by week last year…the green line is this year…and the blue line is the 15 year average for each week. Follow the green line below.
Mortgage rates remain elevated, which can hold back sales levels.
It is speculated that 6.5% could be the “magic number”; to increase activity. When 30 year mortgage rates trend below that number and stay there for a reasonable period of time, more buyers may come off of the sidelines and resale listing inventory will start to come back online at a higher rate than what we are seeing currently.
The Median sale price in the Charleston market continues to stay in a tight band between $400k and $420k where it has been for most of the last 18 months.
Active Inventory stands at 2,850 listings. While this level of inventory is a significant increase over the listing “floor” that we set in February of 2022, We still need roughly 4,100 additional listings market wide to achieve a balanced market (5 months of inventory).
How Mortgage rates effect inventory: About 60% of properties have a mortgage. Of the 60% that have a mortgage, 90% of those mortgages have an interest rate below 5%. Many owners are reluctant to trade their lower interest rates for current market rates.
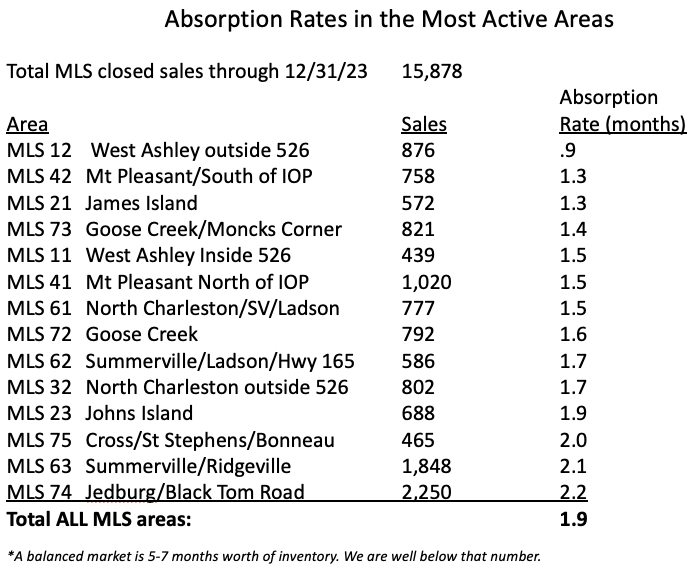
The Charleston market has about six or seven weeks of inventory as a whole, although this can vary some by price range and specific location. It is still a seller’s market. The most active areas have inventory levels in the 4-8 week range.
Nationally, It has been speculated that home prices would crash this year, but prices aren’t in a downward spiral and may actually finish the year strong. This is mainly due to the supply of homes for sale being too low. There are just more buyers looking to buy than homes available and that’s kept prices from falling.
Most Experts Project Home Prices Will Net Positive this Year
The general consensus from industry experts is that home price appreciation will actually be positive for 2023. The graph below shows the latest 2023 year-end forecasts from six different organizations:
The majority of experts are optimistic about home price growth.
The projection from the National Association of Realtors (NAR) is for a slight decline and if you average all six forecasts together, the expectation is that prices will net somewhere around 3.3% positive growth for the year.
One of the six forecasts represented in the graph is the Home Price Expectation Survey (HPES) from Pulsenomics. It combines survey results from over 100 economists, investment strategists, and housing market analysts. The HPES found that the average from all 100 of those experts is 3.3% price growth for the year.
While individual forecasts may vary, both the HPES survey and the average of these forecasts predict positive growth.