Are you thinking about making a move? If so, now may be the perfect time to start the process. That’s because experts say the best week to list your house is just around the corner.
A recent Realtor.comstudy looked at housing market trends over the past several years (with the exception of 2020, since it was an unusual year), and found the best week to put your house on the market this year is April 14-20:
“Every year, one week stands out from the rest as that perfect stretch of time when it’s great to be a home seller. This year, the week of April 14–20 is the best time to sell—that is, if sellers want to see lots of interest in their homes, sell quickly, and pocket some extra cash, according to Realtor.com® data.”
While the spring market is a great time to sell no matter the week, this may be the peak sweet spot. And if you’ve been putting your plans on the back burner and waiting for the right time to act, this could be the nudge you need to make your move happen. As Hannah Jones, Senior Economic Research Analyst at Realtor.comexplains:
“The third week of April brings the best combination of housing market factors for sellers. The best week offers higher buyer demand, lower competition [from other sellers], and fewer price reductions than the typical week of the year.”
If you have considered selling, feel free to contact me for a no-obligation consultation.
If you’re planning to move soon, you might be wondering if there’ll be more homes to choose from, where prices and mortgage rates are headed, and how to navigate today’s market. If so, here’s what the professionals are saying about what’s in store for this season.
Odeta Kushi, Deputy Chief Economist, First American:
“. . . it seems our general expectation for the spring is that we will see a pickup in inventory. In fact, that already seems to be happening. But it won’t necessarily be enough to satiate demand.”
“Where we are right now is the best of both worlds. Price increases are slowing, which is good for buyers, and prices are still relatively high, which is good for sellers.”
“There are slightly more homes for sale than this time last year, and there is still plenty of competition for well-priced houses. Buyers should prep their credit scores and sellers should prep their properties now, attractive listings are going pending in less than a month, and time on market will shrink in the weeks ahead.”
“While mortgage rates remain elevated, home shoppers who are looking to buy this spring could find more affordable homes on the market than they saw at the same time last year. Specifically, there were 20.6% more homes available for sale ranging between $200,000 and $350,000 in February 2024 than a year ago, surpassing growth in other price ranges.”
If you’re looking to sell, this spring might be your sweet spot because there just aren’t many homes on the market. Sure, inventory is rising, but it’s nowhere near enough to meet today’s buyer demand. That’s why they’re still selling so quickly.
If you’re looking to buy, the growing number of homes for sale this spring means you’ll have more choices than this time last year. But be prepared to move quickly since there’ll be plenty of competition with other buyers.
If you need assistance buying or selling a home in the Charleston Area, feel free to contact me! I would be glad to help!
SC Housing Palmetto Heroes Program honors educators, first responders and community service personnel in the fields of law enforcement, corrections, firefighting, emergency medical services and health care, as well as active-duty military, members of the SC Army National Guard, SC Air National Guard and Veterans of the U.S. Armed Forces. The program typically offers a variety financing options with a reduced fixed interest rate AND Down Payment Assistance.
The program is first come first serve and lasts until funds are depleted. Last year (2023) the program featured $10,000 down payment assistance for qualified applicants. 2024 details have not been released yet, but should be announced very soon, within the coming weeks.
I am watching for the details of the new issue. If you are interested in this program, please contact me and I would be glad to help!
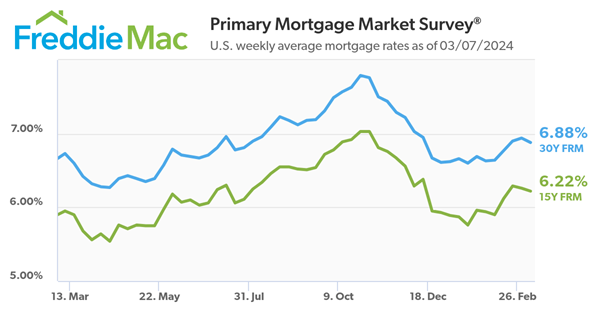
Freddie Mac reports the 30-year FRM averaged 6.88 percent as of March 7, 2024, down from last week when it averaged 6.94 percent. A year ago, at this time, the 30-year FRM averaged 6.73 percent.
As the rates took a small dip, mortgage applications rose, evidence that purchase demand remains sensitive to interest rate changes. Mortgage rates continue to be one of the biggest hurdles for potential homebuyers looking to enter the market.
Where are Rates Headed? No one has a crystal ball but here is what some experts are predicting:
Freddie Mac. With the current stance of monetary policy holding steady, we expect mortgage rates to move sideways, remaining above 6.5% through this quarter and drifting down to about 6% by year’s end. Fannie Mae Housing Forecast. The 30-year fixed rate mortgage will average 6.3% in Q2 2024 and slowly decline over the year, landing at a Q4 average of 5.9%.
National Association of Realtors chief economist Lawrence Yun. “The budget deficit remains high, and the various inflation metrics remain above the comfort level. That means the mortgage rates will likely be in the 6% to 7% range for most of the year.”
Mortgage Bankers Association (MBA). MBA’s baseline forecast is for mortgage rates to end 2024 at 6.1% and reach 5.5% at the end of 2025 as Treasury rates decline and the spread narrows.
Bright MLS chief economist Dr. Lisa Sturtevant. During the early part of the year, expect some bumpiness in rates as new economic data are released and as more buyers get back into the market. However, the overall outlook for mortgage rates in 2024 suggests more rate drops, with Bright MLS forecasts predicting rates to hit 6.2% by the fourth quarter.
If you are considering buying a home and would like help navigating through the process, feel free to contact me.
Here are the latest stats from Charleston Metro MLS – February 2024 calculations.
The median sales price for the Charleston Market has remained fairly steady with a median a sales price of $407,235. up about 6% above February 2023.
While the median sales price has remained in a tight band, between 400k-420k, for most of the previous 24 months, the seasonal dip in median price that is typically experienced around the first of the year bottomed out about 6% above last year’s seasonal dip (2/2023 vs 2/2024), suggesting that the current pricing in our market has a solid base and given low inventory levels relative to sales levels, this could mean that additional price gains lie ahead.
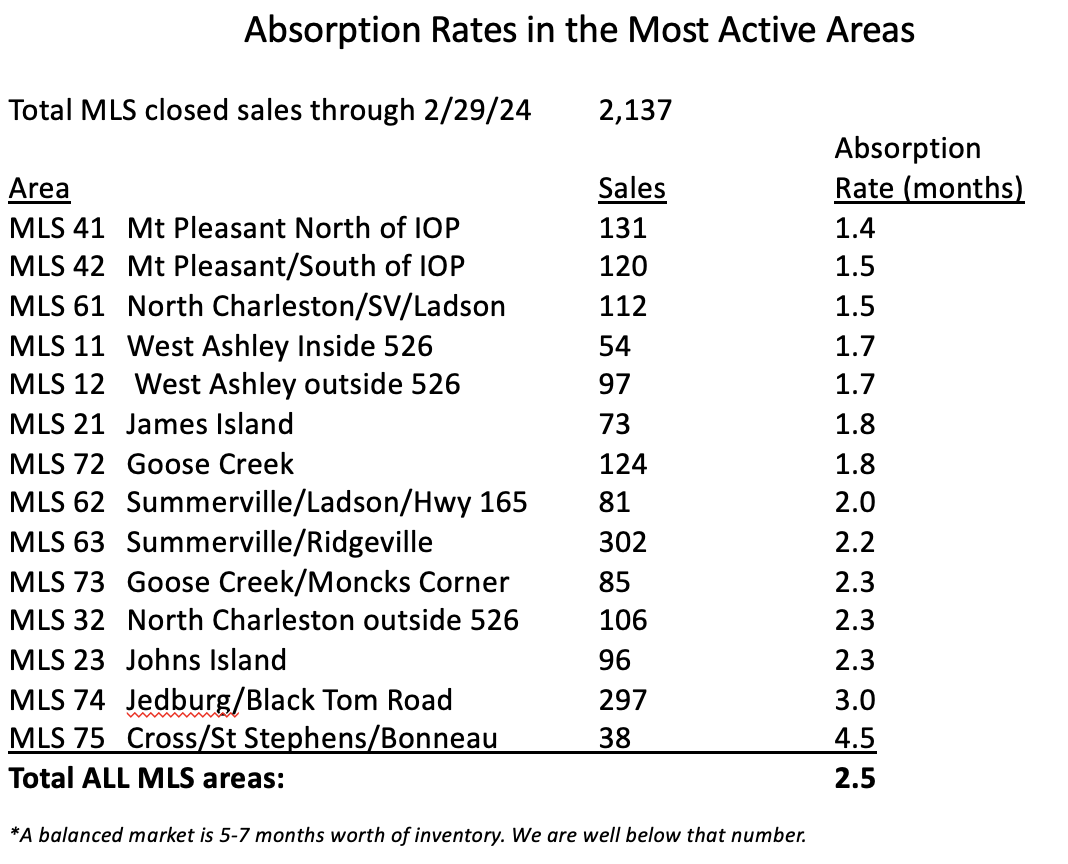
The inventory calculated at February’s end was at 2.5 months, which is an increase over last February’s 1.76 months.
Active Inventory stands at approximately 2,900 listings. While this level of inventory is a significant increase from the low of last February, but we still need roughly 3,500 additional listings market wide to achieve a balanced market (5 months of inventory)
The average days on market was calculated at 48 (median was 25) at February’s end.
Although inventory is low, we have recently had an increase in new listings coming onto the market.
New listings taken have gone up dramatically over the past sixty days with more than 2,000 new listings coming online in February, +36% to the number of listings taken last February. This should help drive sales this spring and summer.
1287 sold properties in February 2024, up 11.6 % from last February’s but written sales, market wide, was down -4%.
Last week saw 291 properties go under contract.
New construction represents 41% of all pending contracts in the MLS and new construction comprises about 35% of the closings.
Foreclosures and Short Sales continue to hold at a combined .7% of all available listings currently. This is down from 1.8% of all available listings on 1/1/2020. There are very few “newly distressed” properties in the pipeline.
Surprisingly, we are at roughly double the monthly pre-pandemic sales levels of properties over one million. This market segment remains surprisingly robust.
Keep in mind, this is a snapshot of the entire Metro Market, real estate is hyper-local and stats will vary within the different areas of the market. If you would like information about your property or neighborhood, please don’t hesitate to contact me.
Wondering if it still makes sense to sell your house right now? Everyone’s situation is unique, but the current market could prove to be beneficial for you.
An article from Calculated Risk shows there are 15.6% more homes for sale now, nationally, compared to the same week last year. That tells us inventory has grown. But going back to 2019, the last normal year in the housing market, there are nearly 40% fewer homes available now:
How this could benefit you when you sell.
1. You Have More Options for Your Move
If you are going to move to another home, the year-over-year growth gives you more options for your home search. This means it may be a little less of a challenge to find what you’re looking for.
2. You Still Won’t Have as Much Competition When You Sell
Even though there are more homes for sale now, there still aren’t as many as there’d be in a normal year. Remember, the data from Calculated Risk shows we’re down nearly 40% compared to 2019. And that large a deficit won’t be solved overnight. As a recent article from Realtor.comexplains:
“. . . the number of homes for sale and new listing activity continues to improve compared to last year. However the inventory of homes for sale still has a long journey back to pre-pandemic levels.”
Less competition means you may find an eager buyer quickly and get your home sold for top dollar.
Bottom Line
So, If you’re a looking to make a move, NOW could prove to be a great time! You’ll have more options when buying your next home than you did last year, and there’s not a ton of competition from other sellers.
If you have considered selling, I would be happy to provide you with information and resources to help you determine if the timing is right for you to make a move.
Over the past few months, experts have revised their 2024 home price forecasts based on the latest data and market signals, and they’re even more confident prices will rise, not fall.
What’s caused the change?
2024 Home Price Forecasts: Then and Now
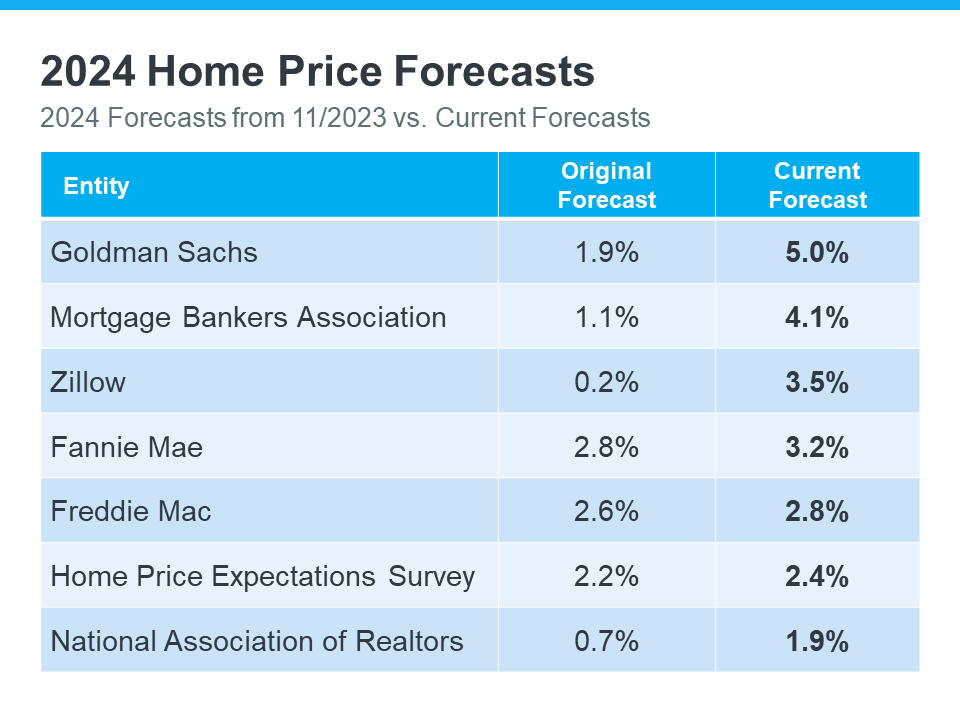
The chart below shows what seven expert organizations think will happen to home prices in 2024. It compares their first 2024 home price forecasts (made at the end of 2023) with their newest projections:
The middle column shows that, at first, these experts thought home prices would only go up a little this year. But if you look at the column on the right, you’ll see they’ve all updated their forecasts and now think prices will go up more than they originally thought. And some of the differences are major.
There are two big factors keeping such strong upward pressure on home prices. The first is how few homes are for sale right now. According to Business Insider:
“Low home inventory is a chronic problem in the US. This has generally kept home prices up . . .”
A lack of housing inventory has been pushing prices up for a long time now – and that’s not expected to change dramatically this year. But what has changed a bit is mortgage rates.
Late last year when most housing market experts were calling for home prices to rise only a little bit in 2024, mortgage rates were up and buyer demand was more moderate.
Now that rates have come down from their peak last October, and with further declines expected over the course of the year, buyer demand has picked up. That increase in demand, along with an ongoing lack of inventory, is what’s caused the experts to feel the upward pressure on prices will be stronger than they expected a couple months ago.
A Look Forward To Get Ahead of the Next Forecast Revisions
Real estate experts regularly revise their home price forecasts as the housing market shifts. It’s a normal part of their job that ensures their projections are always up-to-date and factor in the latest changes in the housing market.
That means they’ll continue to revise their projections as the housing market changes, just as they’ve always done. How those forecasts change next is anyone’s guess but pay attention to mortgage rates.
If they trend down as the year goes on, as they’re expected to do, that could lead to more buyer demand and even higher home price forecasts.
Basically, it’s all about supply and demand. With supply still so limited, anything that causes demand to go up will likely cause prices to go up, too.
Bottom Line
At first, experts believed home prices would only go up a little this year. But now, they’ve changed their minds and are forecasting that prices will grow even more than they originally thought.
If you have considered buying or selling a home this year, I would love to help! Please feel free to contact me.
Have you been thinking about selling your house? If so, here’s some good news. While the housing market isn’t as frenzied as it was during the ‘unicorn’ years when houses were selling quicker than ever, they’re still selling faster than normal.
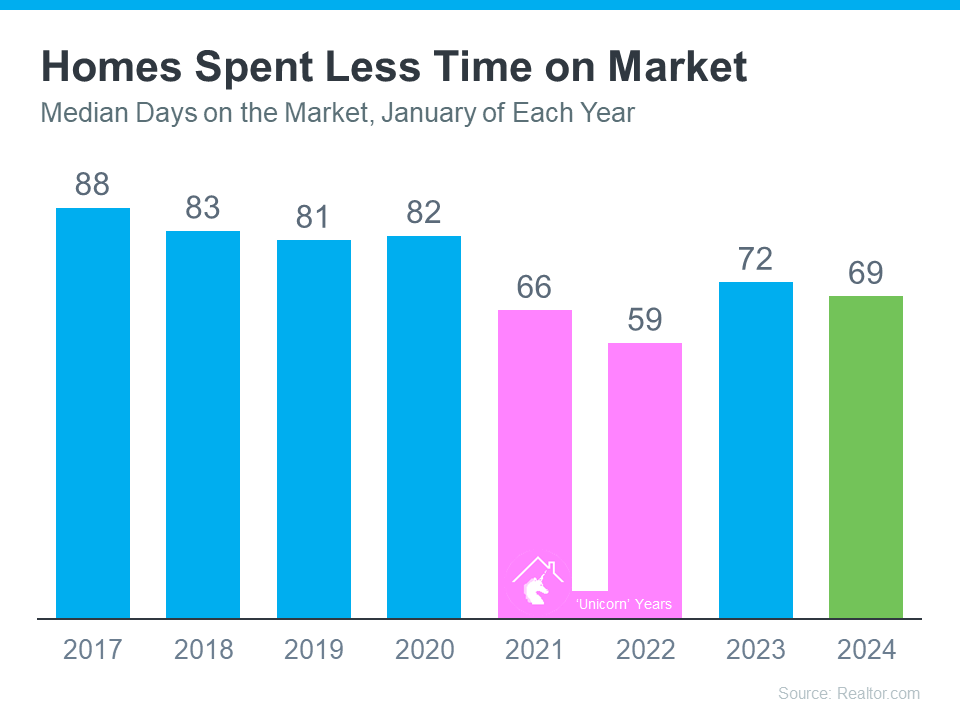
The graph below uses data from Realtor.com to tell the story of median days on the market for every January from 2017 all the way through the latest numbers available. For Realtor.com, days on the market means from the time a house is listed for sale until its closing date or the date it’s taken off the market. This metric can help give you an idea of just how quickly homes are selling compared to more normal years:
When you look at the most recent data (shown in green), it’s clear homes are selling faster than they usually would (shown in blue). In fact, the only years when houses sold even faster than they are right now were the abnormal ‘unicorn’ years (shown in pink). According to Realtor.com:
“Homes spent 69 days on the market, which is three days shorter than last year and more than two weeks shorter than before the COVID-19 pandemic.”
Locally, The Charleston MLS is currently at 27 days on Market.
What Does This Mean for You?
Homes are selling faster than the norm for this time of year – and your house may sell quickly too. That’s because more people are looking to buy now that mortgage rates have come down, but there still aren’t enough homes to go around. Mike Simonsen, Founder of Altos Research, says:
“. . . 2024 is starting stronger than last year. And demand is increasing each week.”
Bottom Line
If you’re wondering if it’s a good time to sell your home, the most recent data suggests it is. The housing market appears to be stronger than it usually is at this time of year. To get the latest updates on what’s happening in our local market, let’s connect.
According to the latest report from Zillow, reported by Globalflare, the state of South Carolina was recently ranked as the #1 state in America for selling the most homes per capita.
The Palmetto State is currently experiencing an impressive rate of 77.30 homes sold for every 100,000 residents. Over the course of the last month, a total of 4,071 houses and apartments changed hands, with an average selling price of $301,659.
Methodology: Zillow was checked to see recently sold houses and apartments over the last 30 days across America.
A capital gain is the profit made when selling an investment or asset, including real estate. The capital gains tax is the levy on that profit when an investment is sold. It is owed for the tax year during which the investment is sold.
Long-term capital gains tax is the tax levied on profits of an asset or investment that was owned for over one year. The long-term capital gains tax rate vary and depend on your income but the rates are typically lower than your ordinary income tax rate
If the investment or asset is owned for less than a year when the gain is made, then the short-term capital gains tax applies. The short-term rate is typically determined by the taxpayer’s ordinary income bracket – but can vary in some circumstances.
The Primary Residence Exclusion. IRS – Section 121
The Internal Revenue Service (IRS) allows homeowners to exclude a certain amount of gains that result from the sale of their primary home from their income. This is known as the Section 121 rule.
Single Homeowners may exclude up to $250,000 of gains on the sale of their property, and married homeowners filing jointly can exclude up to $500,000.
To be eligible for these exclusions You must have owned the home for at least two years AND have lived in the home as your primary residence for at least two years of the previous five years prior to the sale date. The two-year period does not have to be consecutive. See More Here at IRS
Investment Property Deferment- 1031 Tax Exchange in Real Estate
Section 1031 is a provision of the Internal Revenue Code (IRC) that allows a businesses or the owners of investment property to defer federal taxes on some exchanges of real estate. The provision is used by investors who are selling one property and reinvesting the proceeds in one or more other properties.
Qualifying Section 1031 exchanges are called 1031 exchanges, or like-kind exchanges.
In General, A 1031 exchange allows investors to defer taxes on the profits of sold investments. The exchange can be complex with rigid time frames for identifying the replacement property and reqiures a Qualified Intermediary (QI) to oversee and process and the funds.
Tax laws and codes are complex and can change, always consult a tax professional to review your unique situation.