Tag Archives: realtor

Market Review – Charleston Area MLS -February Update 2026

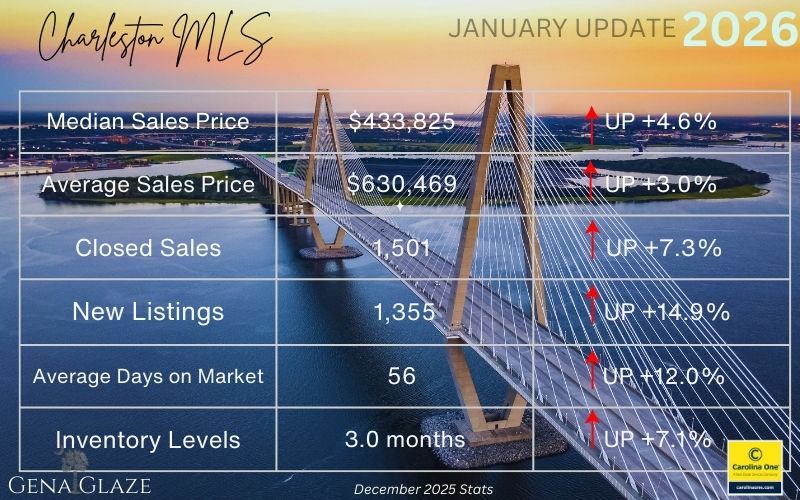
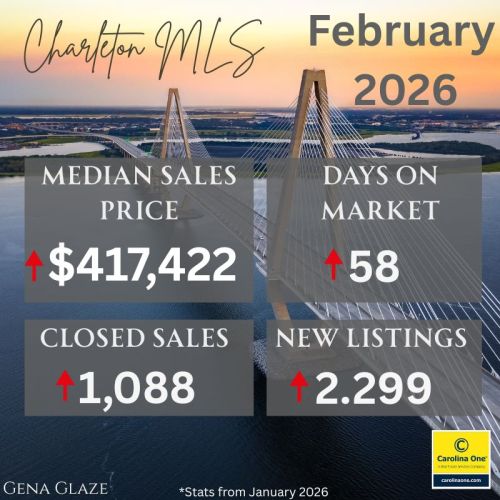
CLOSED SALES – There were1,088 closed sales in January of 2026, up 3.2.% from January of 2025

SALES PRICE – The median sales price closed out at $417,422 up +0.3% year-over-year, and the average sales price for January 2026 was $707,670

PRICE PER SQFT – The average price per sqft for all residential property types was at $311 | up +4.7%

NEW WRITTEN SALES (Pending) – There were 1,536 new written sales in January 2026, up + 17.8% This is an indicator of future closed sales – a good start for 2026!

INVENTORY – Approximately 2,299 new listings (all property types) came online in January of 2026, which is upc+19.2% with the average Days on Market at 58, up +16% and 3.2 months of inventory.

NEW CONSTRUCTION

New construction represents 40% of all pending contracts in the MLS and new construction comprises about 34% of the closings.

  • 14% of all closings in Charleston County are new construction
  • 38% of all closings in Dorchester County are new construction
  • 53% of all closings in Berkeley County are new construction

JANUARY MEDIAN SALES PRICE BY COUNTY:

Berkeley County  
$395,000 – Up +1.5%

Dorchester County
$367,500 – Down -3.3%

Charleston County
$665,000 – Up +10.8%

Real Estate is Hyper Local. Market statistics vary by location, if you would like a detailed report of your neighborhood and home’s value, feel free to contact me.

Gena Glaze

Leave a comment

Filed under Charleston SC Market Stats, Market Statistics, Real Estate (Market info)

Market Review – Charleston Area MLS -January Update 2026

CLOSED SALES – There were1,501 closed sales in December of 2025, up 4.6% from December of of 2025

SALES PRICE – The median sales price closed out at $433,825| up+4.6% year-over-year, and the average sales price for November 2025 was$630,469 up+3.0%

PRICE PER SQFT – The average price per sqft for all residential property types was at $295 | up +1.4%

NEW WRITTEN SALES (Pending) – There were 1,181 new written sales in December 2025, up+16.2% This is an indicator of future activity and seems to be a good sign for 2026.

INVENTORY – Approximately 1,355 new listings (all property types) came online in December of 2025, which is upc+14.4% with the average Days on Market at 56, up +12% and 3.0 months of inventory.

NEW CONSTRUCTION

new construction comprises about 34% of the closed sales and represents 37% of all pending contracts in the MLS

  • New Homes “pendings” will always be higher than new homes closings as new construction typically sits in pending status for far longer than a resale, and the new homes tend to “pile up” in pending status, so new homes actually represent about 34% of the sales market currently
  • New homes represent 24% of the available inventory currently
  • 14% of all closings in Charleston County are new construction
  • 38% of all closings in Dorchester County are new construction
  • 53% of all closings in Berkeley County are new construction

DECEMBER MEDIAN SALES PRICE BY COUNTY:

Year over Year – 2024 VS 2025

Nationally– Year Over Year – There was 3.0% decrease in pending home sales according to the National Association of Realtors. Regionally, there were gains in in the South and declines in the Northeast, Midwest, and West

Charleston MLS – 2025 Closed sales were at approximately 5,000 which was about the same as they were in 2024. New listing total for the year came in at 6,012, up just 1% from 2024 and the median sales price was up just 1.3 %.

The Takeaway: December 2025 saw some increases in closed sales, price, and inventory compared to December 2024, but the year-over-year comparison (2024/2025) was relatively flat, with 2025 statistics very similar to those of 2024. However, December 2025 experienced an impressive 16% increase in Pending Sales (new written sales/not closed), which is an indicator of future closed sales and could be a positive sign for 2026.

Gena Glaze

Leave a comment

Filed under Charleston SC Market Stats, Market Statistics, Real Estate (Market info)

Market Review – Charleston Area MLS – December Update 2025

CLOSED SALES – There were1,229 closed sales in November of 2025, down-7.8% from November of 2024.

SALES PRICE – The median sales price closed out at $421,968 | up+0.6% year-over-year, and the average sales price for November 2025 was$665,985 | up+8.8%

PRICE PER SQFT – The average price per sqft for all residential property types was at $228 | up +3.2%

NEW WRITTEN SALES (Pending) – There were 1,286 new written sales in November 2025, up+4.0%

INVENTORY – Approximately 2,653 new listings (all property types) came online in November of 2025, which is up+4.4% with the average Days on Market at 52, up +8.3% and 3.5 months of inventory.

NEW CONSTRUCTION

  • New homes represent 28% of closed sales, which is down approximately 26%

The Takeaway: Closed sales dipped slightly, but with mortgage rates easing, more buyers are jumping back in, as seen in the rise in loan applications and new sales contracts. New listings climbed about 4%, adding to inventory and lengthening days on market, though we’re still short of the supply needed for a balanced market.

OCTOBER MEDIAN SALES PRICE BY COUNTY:

Berkeley $380,000 | down-4.0%

Dorchester $385,000 | up+4.1%

Charleston $636,000 | down-2.2%

Gena Glaze

Leave a comment

Filed under Charleston SC Market Stats, Market Statistics, Real Estate (Market info)

Market Review – Charleston Area MLS – November Update 2025

CLOSED SALES – There were1,379 closed sales in October of 2025, up 0.9% from October of 2024.

SALES PRICE – The median sales price closed out at $425,885 | up+2.0% year-over-year, and the average sales price for October 2025 was$653,949 | up +1.3%

PRICE PER SQFT – The average price per sqft for all residential property types was at $292, down -3.3%

NEW WRITTEN SALES (Pending) – There were 1,580 new written sales in October 2025, up +2%

INVENTORY – Approximately 2,134 | listings (all property types) came online in October of 2025, which is up+8.5% and the average Days on Market was at 54, up +22.7% with 3.2 months of inventory.

NEW CONSTRUCTION

  • New homes represent 37% of closed sales
  • 18% of all closings in Charleston County were new construction
  • 35% of all closings in Dorchester County were new construction
  • 53% of all closings in Berkeley County were new construction

OCTOBER MEDIAN SALES PRICE BY COUNTY:

Berkeley $402,900 | up +6.0%

Dorchester $370,000 | up +1.3%

Charleston $685,000 | up+11.4%

Gena Glaze

Leave a comment

Filed under Charleston SC Market Stats, Market Statistics, Real Estate (Market info)

Market Review – Charleston Area MLS – October Update 2025

CLOSED SALES – There were 1,381 closed sales in September of 2025, up 8.9% from September of 2024.

PRICE PER SQFT – The average price per sqft for all residential property types was at $296,up 0.7%

SALES PRICE – The median sales price closed out at $423,930 in September 2025, up+3.4% over September of 2024 and the average sales price for August 2025 was $$634,965 The median sales price is still holding steady. It has been in a tight band between 400k and 425K most of the last 3 years.

NEW WRITTEN SALES (Pending) – There were 1,355 new written sales in September 2025, up 0.8% versus September 2024.

INVENTORY – Approximately 2,016 new listings (all property types) came online in September of 2025, which is up 0.1% from September 2024 and the average Days on Market was at 52 (up 20.9%) with 3.7 months of inventory

NEW CONSTRUCTION

  • New homes represent 23% of the available inventory
  • 18% of all closings in Charleston County were new construction
  • 35% of all closings in Dorchester County were new construction
  • 53% of all closings in Berkeley County were new construction

SEPTEMBER MEDIAN SALES PRICE BY COUNTY:

Berkeley $399,945 | up +5.3%

Dorchester $385,000 | +4.9%

Charleston $600,000 | -6.3%

Gena Glaze

Leave a comment

Filed under Charleston SC Market Stats, Market Statistics, Real Estate (Market info)

APR vs. Interest Rate

Is there a difference?

APR (Annual Percentage Rate) includes costs and fees associated with the loan. The interest rate does not. The interest rate is simply the rate you pay on the loan, excluding any other costs.

Looking at the interest rate alone is not an effective way to evaluate a loan. The APR is much more effective, as it factors in the interest rate PLUS any other costs to finance the loan, providing a much more holistic view.

When you apply for a loan, you should always be able to see both the interest rate and the APR. If you don’t, ask your lender to provide both.

If you compare two loans with the same interest rate (note rate) and the APR is higher on one – you should find out what the additional costs are. This comparison will help you evaluate the loan products more effectively.

Leave a comment

Filed under Learn Real Estate Terms

Market Review – Charleston Area MLS – September Update 2025

SALES PRICE – The median sales price closed out at $424,000 in August 2025, up+1.2% over August of 2024 and the average sales price for August 2025 was $678,987.

NEW WRITTEN SALES (Pending) – There were 1,568 new written sales in August 2025, up 11.9% versus August 2024. Approximately 480 of these sales were new construction, up+15.7%

CLOSED SALES – There were 1,547 closed sales in August of 2025, up 0.9% from August of 2024. New construction closed sales accounted for 28% of these sales, up +11.6%

INVENTORY – Approximately 2,164 new listings (all property types) came online in August of 2025, which is up +11.1% from August 2024 and the average Days on Market was at 52 (up 23.8%) with 4.1 months of inventory. 581 of August’s new listings were new construction, up 26.3%  Previously owned homes (non-new construction) days on market was up+47.1%.

PRICE PER SQFT – The average price per sqft for all residential property types was at $230, up 3.6%.

SHOWINGS PER LISTING – 3.8 | down -7.3%

AUGUST STATS BY COUNTY:

Berkeley – The median sales price was $399,923 | up +0.2% The average sales price was $466,057 and the average days on market was 54. Closed sales (503) were up 0.6%, year over year, 45% of the closed sales were new construction (up 10%)

Charleston – The median sales price was $675,000 | up +12.5%. The average sales price was $1,031,255 and the average days on market was 49 | up+48.5%. Closed sales (652) | up +2.5% New Construction represented 12 % of these sales (up 65.2%).

Dorchester – The median sales price was $372,500 | up +0.5%. The average sales price was $385,433  and the average days on market was 41 | up +32.3%. Closed sales (317) were down -11.7%. New Construction represented 40% of the closed sales.

Gena Glaze

Leave a comment

Filed under Charleston SC Market Stats, Market Statistics, Real Estate (Market info)

Market Review – Charleston Area MLS – August Update 2025

Entire Charleston MLS (July Stats):

SALES PRICE – The median sales price closed out at $430,000 in July 2025, up +1.2% over July of 2024 and the average sales price for July 2025 was $620,556 

NEW WRITTEN SALES (Pending) – There were 1,577 new written sales in July 2025, up 11% versus July 2024.

CLOSED SALES – There were 1,719 closed sales in July of 2025, up 7.4% from July of 2024.

INVENTORY – Approximately 2,290 new listings (all property types) came online in July 2025, which is up +5% from July 2024 and the average Days on Market was at 45 with 3.6 months of inventory (up 16%). 1712 of July’s new listings were existing homes (non-new construction) this category is at 3.9 months of inventory, up 30%

PRICE PER SQFT – The average price per sqft for all residential property types was at $289 but for resales (non-new construction) it was calculated at $311 / sqft.  Despite a fairly stable Median Sale Price, this increase in price per sqft suggests consumers are getting a smaller house for the money (higher Sold $/sqft).

New Construction – New construction represents about 36% of the closings in MLS. In Berkeley County new construction represents 56% of all closed sales.

JULY STATS BY COUNTY:

Berkeley – The median sales price was $395,000 | down -0.3%. The average sales price was $500,965 and the average days on market was 45 | up +21.6%

Charleston – The median sales price was $623,225 | down -1.7%The average sales price was $870,712 and the average days on market was 39 | up +25.8%

Dorchester – The median sales price was $389,500 | up +2.3%. The average sales price was $417,491 and the average days on market was 42 | up +20%

JULY STATS – QUICK VIEW OF MUNICIPLAITIES:

Goose Creek– The median sales price was $314,900 | down -4.3% The average sales price was $317,088 |

Hanahan – The median sales price was $365,000 | down -1.3%, The average sales price was $431,131 

Summerville – The median sales price was $399,990 | no change 0.0%, The average sales price $431,092

North Charleston – The median sales price was $346,450 | down -0.4% The average sales price was $392,508 

Charleston / West Ashley – The median sales price was $585,000 | down -8.5% The average sales price was $875,381 

Mount Pleasant -The median sales price was $955,000 | up +9.1%, The average sales price was $1,127,187 

Daniel Island -The median sales price was $1,600,000 | up +7.4% The average sales price was $1,314,444 

James Island The median sales price was $338,000 | down -47.6%, The average sales price was $338,000 

Gena Glaze

Leave a comment

Filed under Charleston SC Market Stats, Market Statistics, Real Estate (Market info)

Market Review – Charleston Area MLS- February Update 2025

February 2024 Update for the entire Charleston MLS:

NEW SALES – Pending – There were 1379 new written sales in January 2025, down -6.1% versus January of 2024.

CLOSED SALES – There were 1045 closed sales in January of 2025, up 2.8% from January of 2024

SALES PRICE – The Median sales price closed out at $415,917, up 0.2% over January of 2024 and the average sales price for January 2024 was $631,715

INVENTORY – Approximately 1,907 new listings came online in January 2025, which is up +2.3% from January 2024 and the average Days on Market was at 50, up 28.2% from January of 2024 with 2.7 months of inventory.

Gena Glaze

Leave a comment

Filed under Market Statistics, Real Estate (Market info)

Using Gift Funds For The Down Payment on your Home

In today’s market, more and more home buyers are getting assistance with their down payment in the form of gift funds from friends and family. According to a recent study, in 2023, 39% of home buyers who financed their home with a mortgage loan used gifted funds as at least one source for their down payment, up nine percentage points from 2018. While it’s great to have help, there are rules around financial gifts that you need to know in order to smoothly navigate the process.

What is a down payment gift?

Down payment money is considered a “gift” when people, usually friends or family, financially contribute money that will help the home buyer pay for a down payment on a home. there is generally no limit on how much a borrower is allowed to receive as a gift

Who is eligible to Gift you down payment money?

Depending on the loan type, gifts can come from the buyer’s relative, employer, or close friend with a “clearly defined and documented” interest in the borrower, or a charitable organization, governmental agency, or a public entity that has a program providing home ownership assistance for low and moderate-income families or first-time home buyers. However, donations for down payments cannot come from people who are directly affiliated with the home buying transaction which includes builders, developers, or real estate agents.

What are the rules for mortgage down payments?

For Fannie Mae backed loans, a minimum borrower contribution from the borrower’s own funds is not required. This means that 100% of the money that is needed to make up the down payment can come from a gift. On the other hand, with FHA loans, the borrower is required to provide a minimum personal cash investment of at least 3.5% for the down payment. regardless of the loan type, gift funds must be a “bona fide gift,” and not a loan that requires repayment.

While there is no limit to how much money you can accept as a gift for a home down payment, when you’re going through the mortgage loan application process, you’ll need to make sure that you have proper documentation of the gift money in the form of a letter, with specific requirements outlined by your lender, from the donor of the funds. this is required to show your letter that you don’t owe someone a large sum of money that you won’t be able to pay back on top of your monthly mortgage payment.

Contact me if you have any questions

Gena Glaze

Leave a comment

Filed under Home Buying (For Buyers)