Category Archives: Real Estate (Market info)

This Category features Charleston area market data and information

Homes More Affordable Today Than 1985-2000


Rising home prices have many concerned that the average family will no longer be able to afford the most precious piece of the American Dream – their own home.

However, it is not just the price of a home that determines its affordability. The monthly cost of a home is determined by the price and the interest rate on the mortgage used to purchase it.

Today, mortgage interest rates stand at about 4.5%. The average annual mortgage interest rate from 1985 to 2000 was almost double that number, at 8.92%. When comparing affordability of homeownership over the decades, we must also realize that incomes have increased.

This is why most indexes use the percentage of median income required to make monthly mortgage payments on a typical home as the point of comparison.

Zillow recently released a report comparing home affordability over the decades using this formula. The report revealed that, though homes are less affordable this year than last year, they are more affordable today (17.1%) than they were between 1985-2000 (21%). Additionally, homes are more affordable now than at the peak of the housing bubble in 2006 (25.4%). Here is a chart of these findings:

Homes More Affordable Today than 1985-2000 | Keeping Current Matters

What will happen when mortgage interest rates rise?

Most experts think that the mortgage interest rate will increase to about 5% by year’s end. How will that impact affordability? Zillow also covered this in their report:

Homes More Affordable Today than 1985-2000 | Keeping Current Matters

Rates would need to approach 6% before homes became less affordable than they had been historically.

Bottom Line

Though homes are less affordable today than they were last year, they are still a great purchase while interest rates are below the 6% mark.

Gena Glaze


Leave a comment

Filed under Home Buying (For Buyers), Mortgage Info, Real Estate (Market info)

Home Prices: The Difference 5 Years Makes

The economists at CoreLogic recently released a special report entitled, Evaluating the Housing Market Since the Great Recession. The goal of the report was to look at economic recovery since the Great Recession of December 2007 through June 2009.

One of the key indicators used in the report to determine the health of the housing market was home price appreciation. CoreLogic focused on appreciation from December 2012 to December 2017 to show how prices over the last five years have fared.

Frank Nothaft, Chief Economist at CoreLogic, commented on the importance of breaking out the data by state,

“Homeowners in the United States experienced a run-up in prices from the early 2000s to 2006, and then saw the trend reverse with steady declines through 2011. After finally reaching bottom in 2011, home prices began a slow rise back to where we are now.

Greater demand and lower supply – as well as booming job markets – have given some of the hardest-hit housing markets a boost in home prices. Yet, many are still not back to pre-crash levels.”

The map below was created to show the 5-year appreciation from December 2012 – December 2017 by state.

Home Prices: The Difference 5 Years Makes | Keeping Current Matters

Nationally, the cumulative appreciation over the five-year period was 37.4%, with a high of 66% in Nevada, and a modest increase of 5% in Connecticut.

Where were prices expected to go?

Every quarter, Pulsenomics surveys a nationwide panel of over 100 economists, real estate experts, and investment and market strategists and asks them to project how residential home prices will appreciate over the next five years for their Home Price Expectation Survey (HPES).

According to the December 2012 survey results, national homes prices were projected to increase cumulatively by 23.1% by December 2017. The bulls of the group predicted home prices to rise by 33.6%, while the more cautious bears predicted an appreciation of 11.2%.

Where are prices headed in the next 5 years?

Data from the most recent HPES shows that home prices are expected to increase by 18.2% over the next 5 years. The bulls of the group predict home prices to rise by 27.4%, while the more cautious bears predict an appreciation of 8.3%.

Bottom Line

Every day, thousands of homeowners regain positive equity in their homes. Some homeowners are now experiencing values even higher than before the Great Recession. If you’re wondering if you have enough equity to sell your house and move on to your dream home, contact ME!

-KCM

Gena Glaze

Leave a comment

Filed under Real Estate (Market info), Stories, News & Events

Charleston Trident Association of Realtors MLS – Stats for January 2018

There were 1,828 new listings in Our local MLS, which includes Charleston, Berkeley, Dorchester counties and some surrounding areas. which is 6.3 % lower than the 1,950 that was listed in January of 2017.

The average  sold  price for january 2018 was $359,713, up 11.37% from January of 2017.

The average list price is $561,488, The median is $349,000, and the absorption rate of approximately 3.28 months. The average Cumulative days on market is 70 and the median is 36

Click the Market Summary link below for full details.

Market Summary Report _ flexmls Web

Image result for stats

Leave a comment

Filed under Real Estate (Market info)

Latest NAR Data Shows Now Is A Great Time To Sell!

We all realize that the best time to sell anything is when demand for that item is high, and the supply of that item is limited. Two major reports released by the National Association of Realtors (NAR) revealed information that suggests that now is a great time to sell your house.

Let’s look at the data covered in the latest REALTORS® Confidence Index and Existing Home Sales Report.

REALTORS® CONFIDENCE INDEX

Every month, NAR surveys “over 50,000 real estate practitioners about their expectations for home sales, prices and market conditions.” This month, the index showed (again) that homebuying demand continued to outpace the supply of homes available in January.

The map below illustrates buyer demand broken down by state (the darker your state, the stronger demand there is).

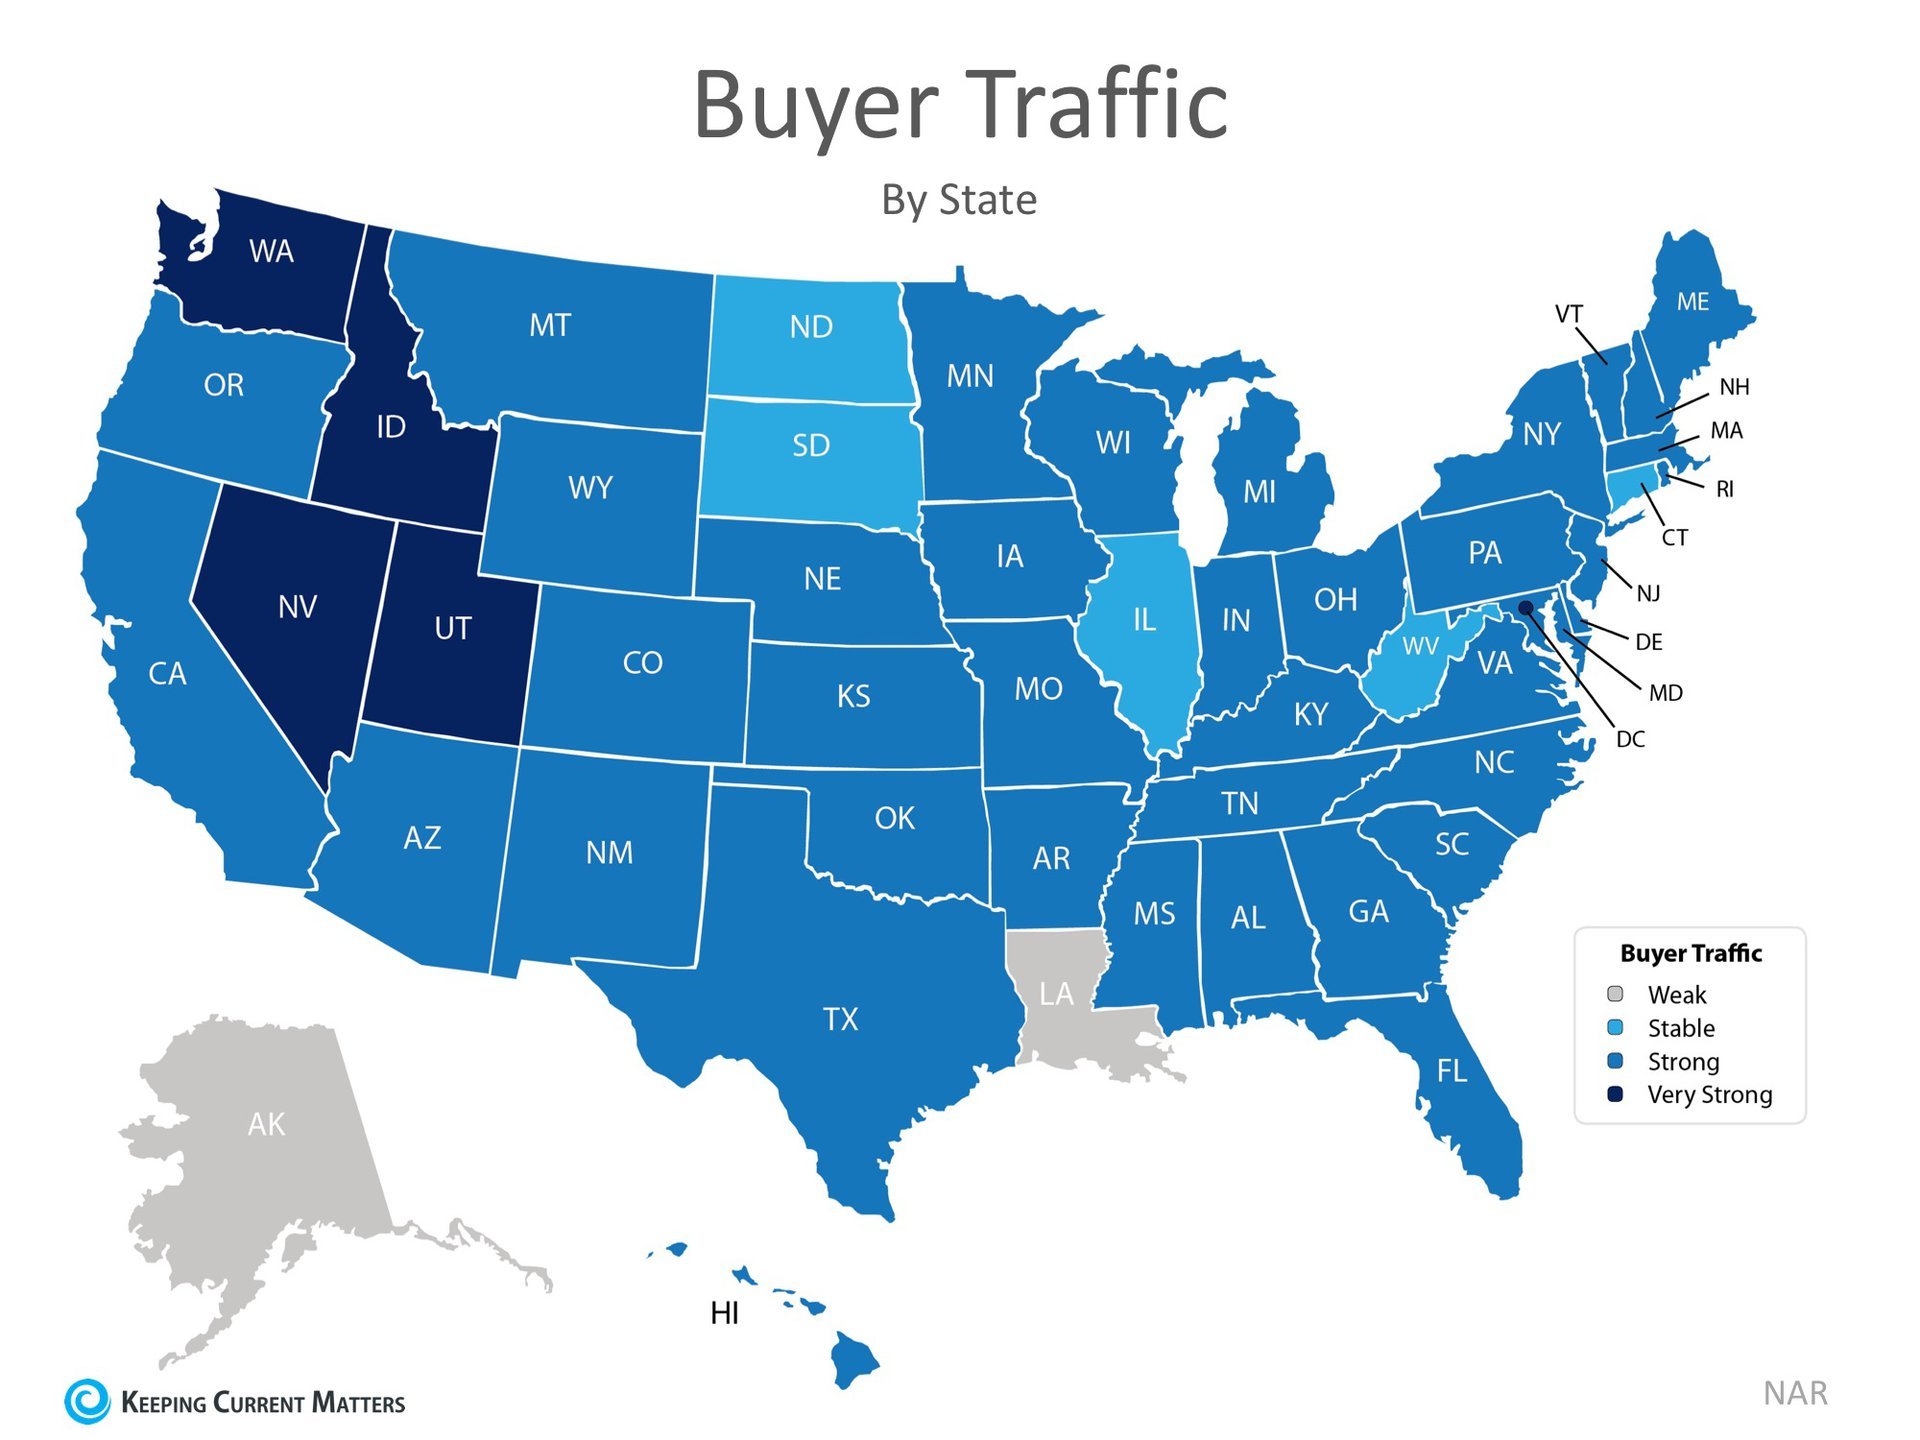
In addition to revealing high demand, the index also shows that compared to conditions in the same month last year, seller traffic conditions were ‘weak’ in 22 states, ‘stable’ in 25 states, and ‘strong’ in only 4 states (Alaska, Nevada, North Dakota & Utah).

Takeaway: Demand for housing continues to be strong but supply is struggling to keep up, and this trend is likely to continue throughout 2018.

THE EXISTING HOME SALES REPORT

The most important data revealed in the report was not sales but was instead the inventory of homes for sale (supply). The report explained:

  • Total housing inventory rose 4.1% from December to 1.52 million homes available for sale.
  • Unsold inventory is 9.5% lower than a year ago, marking the 32nd consecutive month with year-over-year declines.
  • This represents a 3.4-month supply at the current sales pace.

According to Lawrence Yun, Chief Economist at NAR:

“Another month of solid price gains underlines this ongoing trend of strong demand and weak supply. The underproduction of single-family homes over the last decade has played a predominant role in the current inventory crisis that is weighing on affordability.”

In real estate, there is a guideline that often applies; when there is less than a 6-month supply of inventory available, we are in a seller’s market and we will see appreciation. Between 6-7 months is a neutral market, where prices will increase at the rate of inflation. More than a 7-month supply means we are in a buyer’s market and should expect depreciation in home values.

As we mentioned before, there is currently a 3.4-month supply, and houses are going under contract fast. The Existing Home Sales Report shows that 43% of properties were on the market for less than a month when sold.

In January, properties sold nationally were typically on the market for 42 days. As Yun notes, this will continue unless more listings come to the market.

“While the good news is that Realtors in most areas are saying buyer traffic is even stronger than the beginning of last year, sales failed to follow course and far lagged last January’s pace. It’s very clear that too many markets right now are becoming less affordable and desperately need more new listings to calm the speedy price growth.”

Takeaway: Inventory of homes for sale is still well below the 6-month supply needed for a normal market and supply will ‘fail to catch up with demand’ if a ‘sizable’ supply does not enter the market.

Bottom Line

If you are going to sell, now may be the time to take advantage of the ready, willing, and able buyers that are still out searching for your house.

-KCM

Gena Glaze

Leave a comment

Filed under Real Estate (Market info)

Should I Wait Until Next Year To Buy? Or Buy Now?

Gena Glaze

Leave a comment

Filed under Mortgage Info, Real Estate (Market info)

Bidding Wars Abound… How Long Will They Continue?

Just like with any product or service, the law of supply and demand impacts home prices. Any time that there is less supply than the market demands, prices increase.

In many areas of the country, the supply of homes for sale in the starter and trade-up home markets is so low that bidding wars have ensued, and the busy spring-buying season is just around the corner.

CoreLogic recently conducted an analysis on national home prices at the time of sale for their January 2018 MarketPulse Report and found that a third of homes sold for at least list price.

“The share selling above list price was almost three times the trough in January 2008 and represented more than one-fifth of total sales.”

Many markets in the western part of the country and around major cities are experiencing higher shares of homes selling above list price.

“San Francisco had the largest share of homes—76 percent—that sold for at least the list price, and Seattle and Los Angeles followed with 63 and 51 percent, respectively. Miami had the lowest share—16 percent—of homes selling at or above the list price.”

Increased demand during the spring and summer months, the traditionally busier seasons for real estate, will no doubt influence how many homes continue to sell over list price.

This should not be seen by sellers as permission to overprice their homes, though. Buyers are becoming more and more educated, especially those who have been searching for their dream homes for a while now while waiting for new inventory to come to market.

Realtor.com gives this advice:

“Aim to price your property at or just slightly below the going rate. Today’s buyers are highly informed, so if they sense they’re getting a deal, they’re likely to bid up a property that’s slightly underpriced, especially in areas with low inventory.”

Bottom Line

Without a large wave of new listings coming to market, buyers will continue competing with each other for the homes that are available. If you are thinking of selling your home, now may be the time to do so before more competition comes this spring.

Contact me  to help you determine the demand for your house in your area.

-Keeping Current Matters 

Leave a comment

Filed under Real Estate (Market info)

Real Estate Values Today Compared to Pre-2008 Peak

This housing market has many people talking about home values; where they are and where they are headed. It’s also interesting to look back and see how home prices compare to values prior to the housing crisis.

Every quarter, Freddie Mac releases their House Price Index. The index usually provides monthly home values for:
•the nation as a whole
•each of the 50 states
•367 metropolitan statistical areas

This quarter, the report also included a look at today’s home values as compared to Pre-2008 values. Here is a graphic that breaks down the numbers on a state-by-state basis:

Price-Since-Peak-KCM-2-768x576


-KCM

Gena Glaze

Leave a comment

Filed under Home Buying (For Buyers), Real Estate (Market info), Selling Real Estate (For Sellers)

Home for Sale in The Gated Community of the Hamlets – Crowfield Plantation- Goose Creek

103 Kirkhaven Ct Goose Creek SC – Offered at $429,983

20160806180420127625000000-o

4BR, 3B – 2750 SQFT

IMMACULATE ALL-BRICK ONE-STORY HOME ON GOLF COURSE LOT IN THE EXCLUSIVE GATED COMMUNITY OF THE HAMLETS OF CROWFIELD PLANTATION!..This one story home is in excellent condition & is loaded with custom features!…The open floor plan design of this home includes soaring ceilings, gleaming hardwood floors & features a formal dining room, A spacious family Room with gas log fireplace, a built-in computer station & an ”open & bright” kitchen that includes solid surface counter tops, up-graded cabinetry, counter bar & a breakfast area. The rear sun-lit porch is an ”all-season” room as it converts from sunroom to screen porch to take advantage of the golf course views all year long. The home also features a formal living room that has a closet & french doors, would also make a great office..

THE LARGE MASTER SUITE features a vaulted ceiling, Custom walk-in closet and is accompanied by a master bath complete with dual vanities, whirlpool tub, and separate shower!…There are also two additional bedrooms and full bath on the main floor and a HUGE FROG that features a closet and FULL BATH, could be used a SECOND MASTER SUITE!!!!….. Other features include; Fresh paint throughout, custom built-in’s, smooth ceilings, architectural details, transom windows, up-graded light fixtures, ceiling fans, separate laundry, lots of storage space, OVER-SIZED 2 CAR GARAGE (as large as a 3 car but has two doors), a rear patio, expanded driveway,PROFESSIONALLY landscaped lot with irrigation and so much more! ….This is a rare opportunity!…. HARD TO FIND!!..CUSTOM-DESIGNED ONE STORY HOME – ON GOLF COURSE LOT – ON QUIET CUL-DE-SAC STREET – IN AN EXCLUSIVE GATED COMMUNITY!!!! …The gated community is a small community within The Hamlets, it consists of approximately 66 homesites surrounded by the golf course with one gated entrance, owners are provided with a private code and remote to operate the entrance gate…….And don’t forget the amenities that Crowfield has to offer; Pools, Park, Hiker-Biker trails, Club House, Tennis, Lake, Docks, Boat & Camper Storage and a golf course within the community!….MUST SEE!!

Contact me for a private showing!  Gena Glaze

Leave a comment

Filed under Home Buying (For Buyers), Places, Real Estate (Market info)

Nexton-Summerville Celebrating– 100 homes sold!

Nexton Recently  celebrated the sale of their 100th home !

Sixteen months ago Brighton Park Village opened, followed by Nexton Elementary School, and the new Swim Club. Soon boutiques and eateries of Nexton Square will arrive as wellas a village center. All will be  connected to each other with parks and trails

Moe about NEXTON

Gena Glaze

Leave a comment

Filed under Real Estate (Market info)

What States Give You the Most ‘Bang for Your Buck’?

What States Give You the Most ‘Bang for Your Buck’? [INFOGRAPHIC] | Keeping Current Matters

Leave a comment

08/16/2016 · 3:28 pm