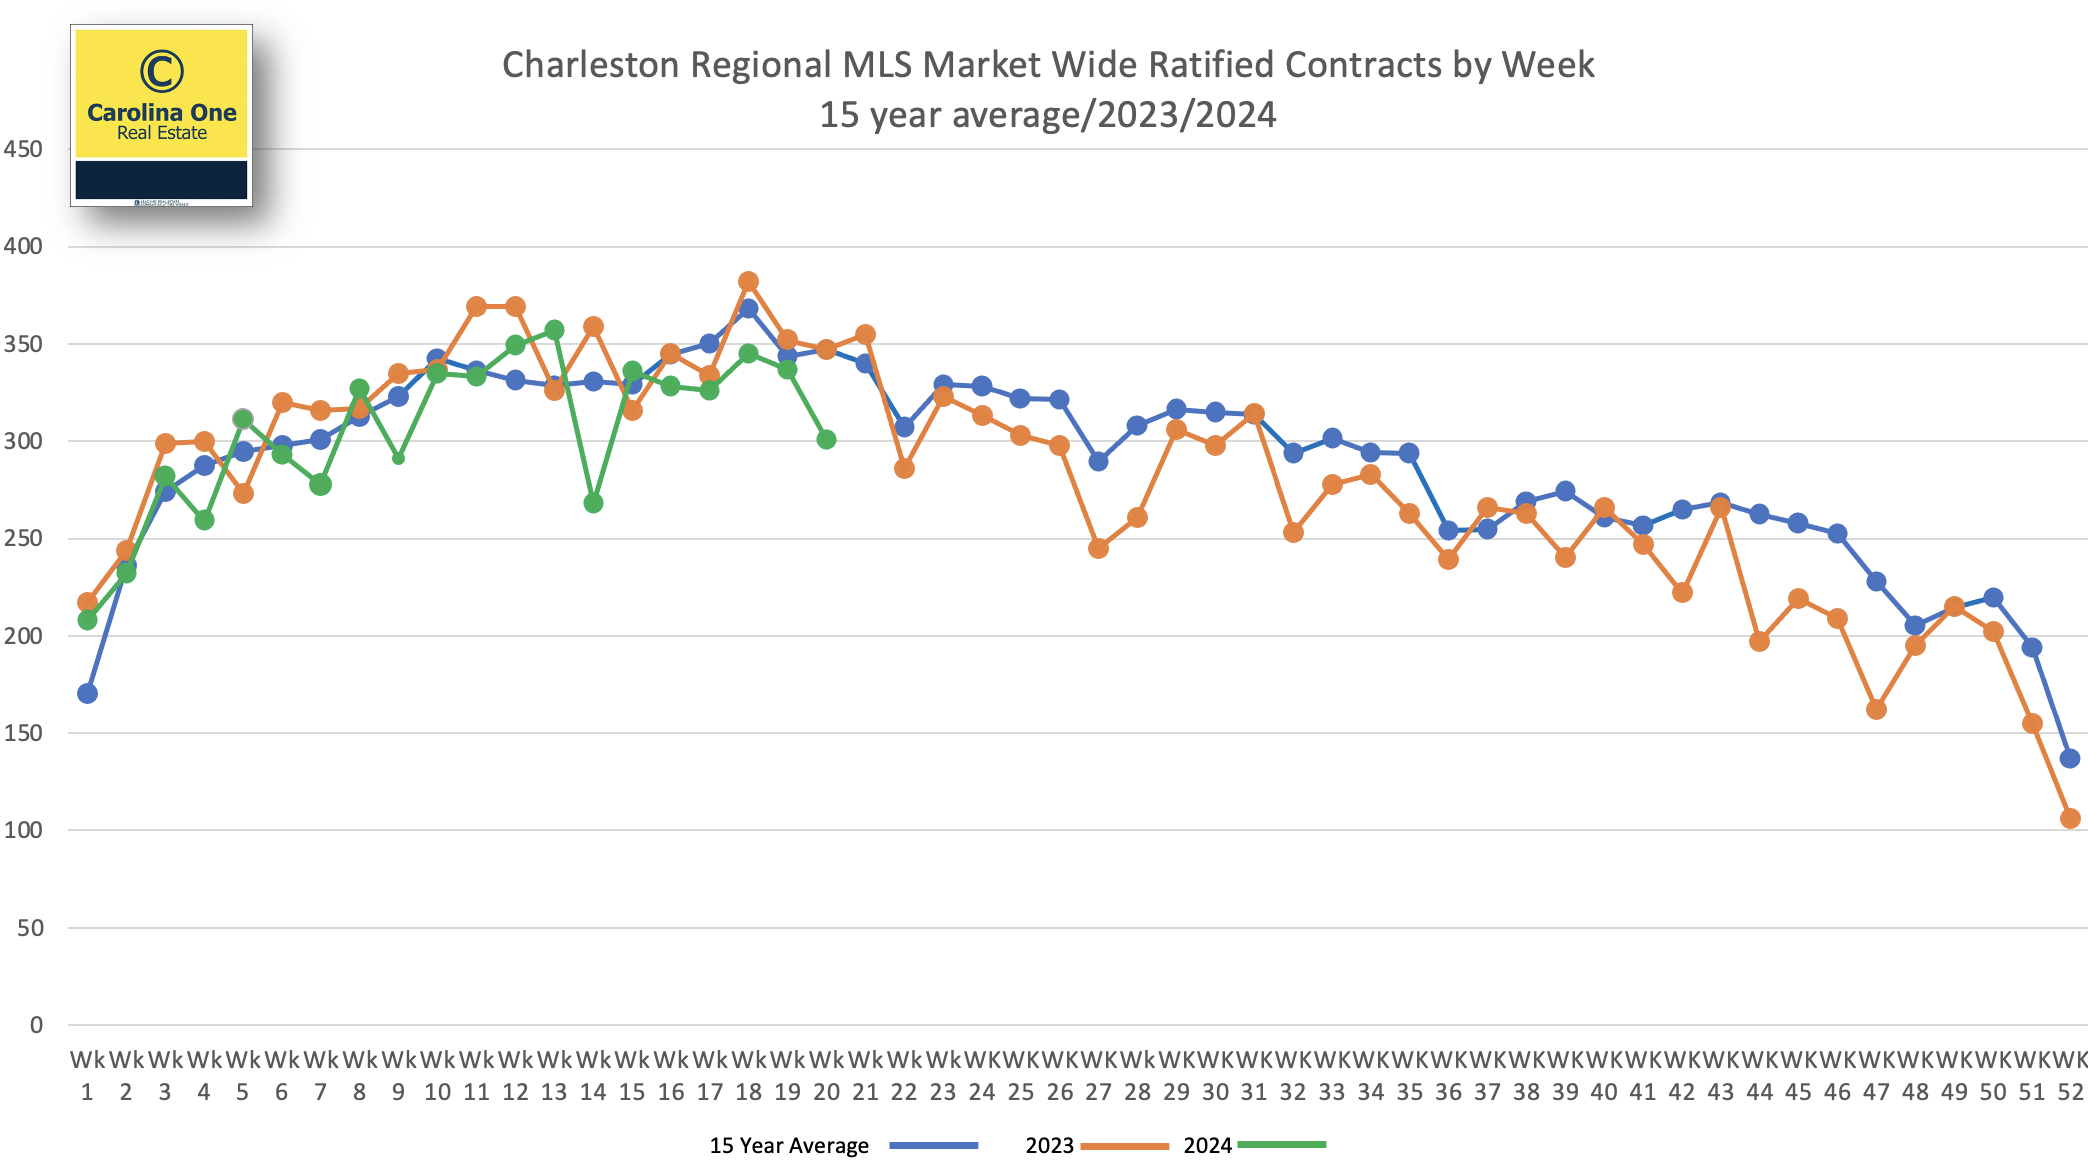
NEW SALES – Pending (Ratified contracts) – New Written sales, a predictor of future closed sales, were down market wide -1% in September of ’24 versus September of ’23. However, last week 255 properties went under contract market wide, +3% from the same week last year. This is a strong and seasonally appropriate number.

CLOSED SALES – Year To date closed sales were at 13,390 at the end of September 2024. A very small difference from the 13,438 at the same time in 2023.
Third Quarter of 2024 closed sales were at 4,396, which is down 3 percent from 2023 (which had 4,510). As a reference, there were 5018 closed sales in 2022.
There were 1,254 closed sales in September 2024 which is down 11 percent from the 1,411 that we saw in September of 2023. Again, as a reference, there were 1,573 closed sales in September of 2022
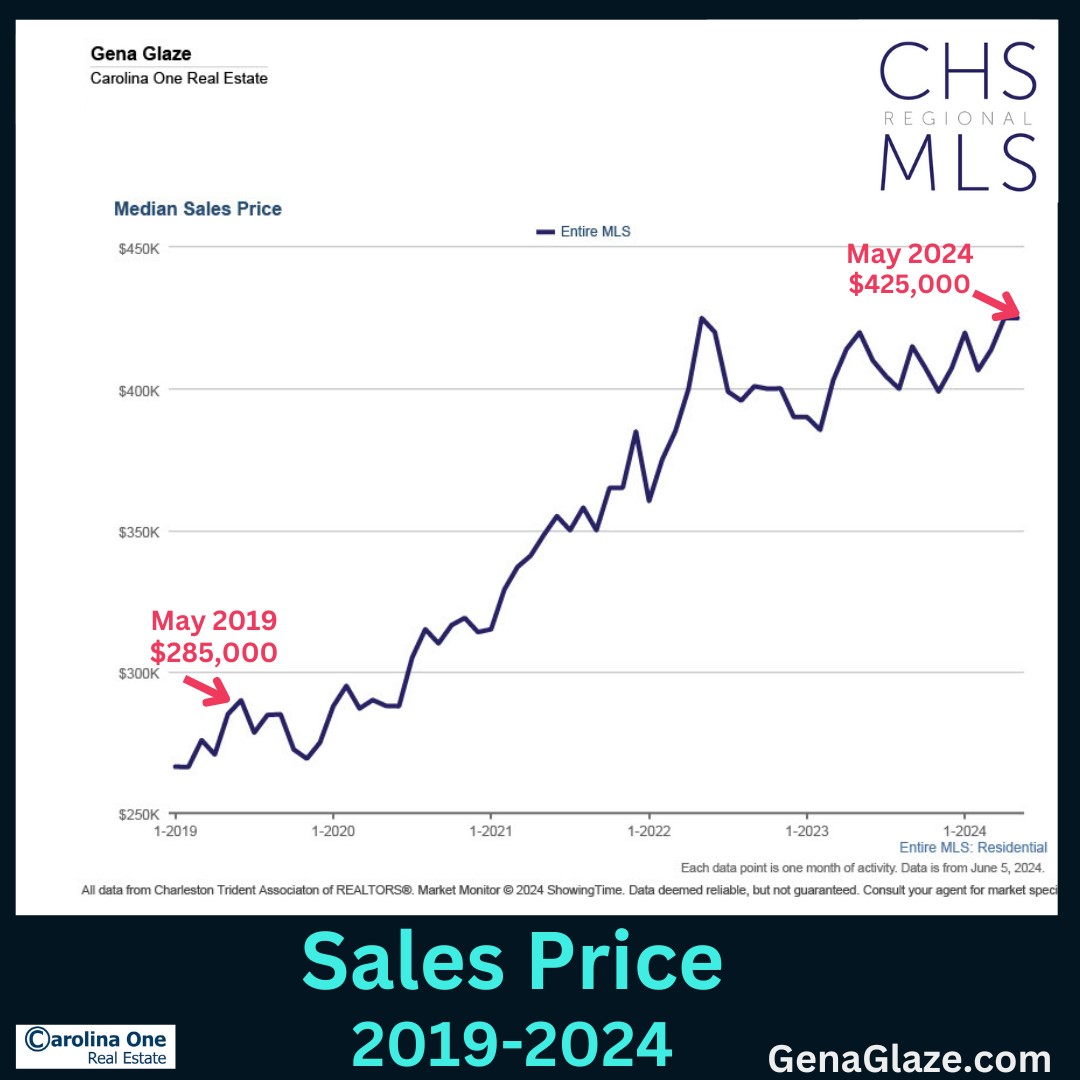
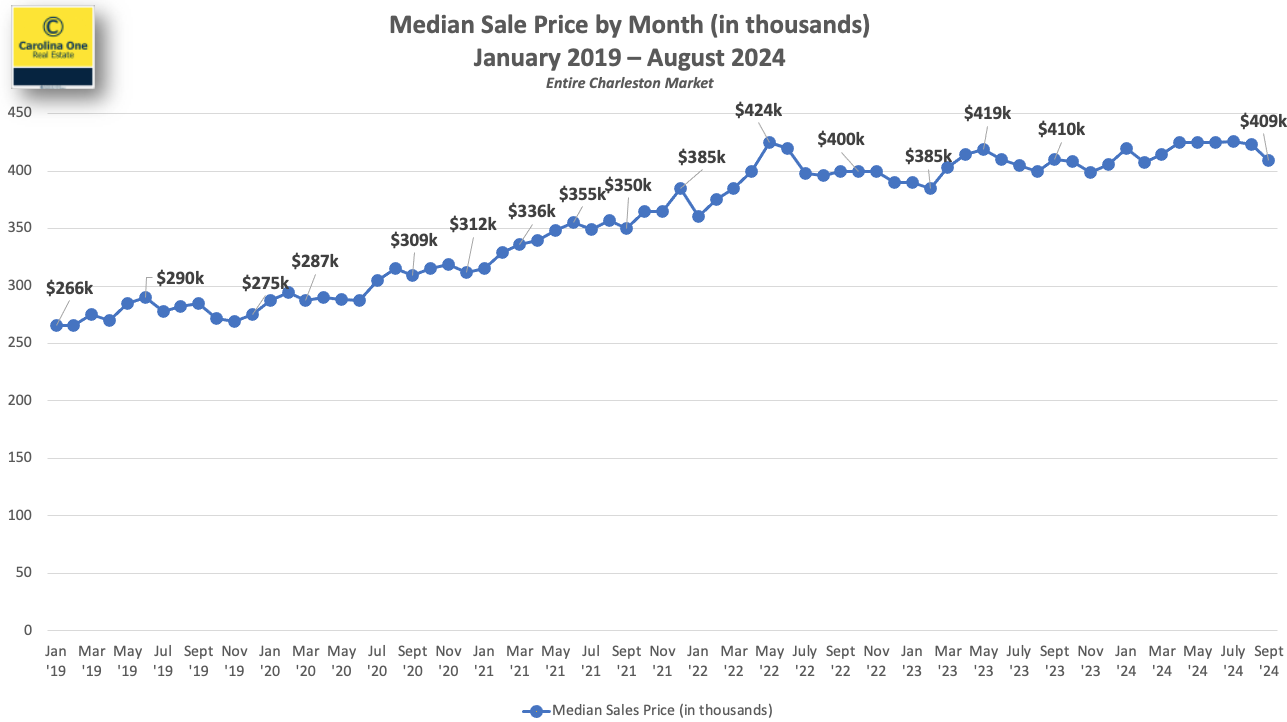
SALES PRICE – The Median sale price closed out at $409,085 in September 2024. The Charleston market continues to stay in a tight band between $400k and $425k where it has been for most of the last 27+ months. The average sales price was $627,254 in September 2024.
AVERAGE SOLD PRICE PER SQFT
The median sales price has remained in a tight band but the average price per sqft remains near an all-time high, well above one year ago. Consumers are getting a smaller house for the money. Essentially, homes are continuing to appreciate despite a stable Median Sale Price.

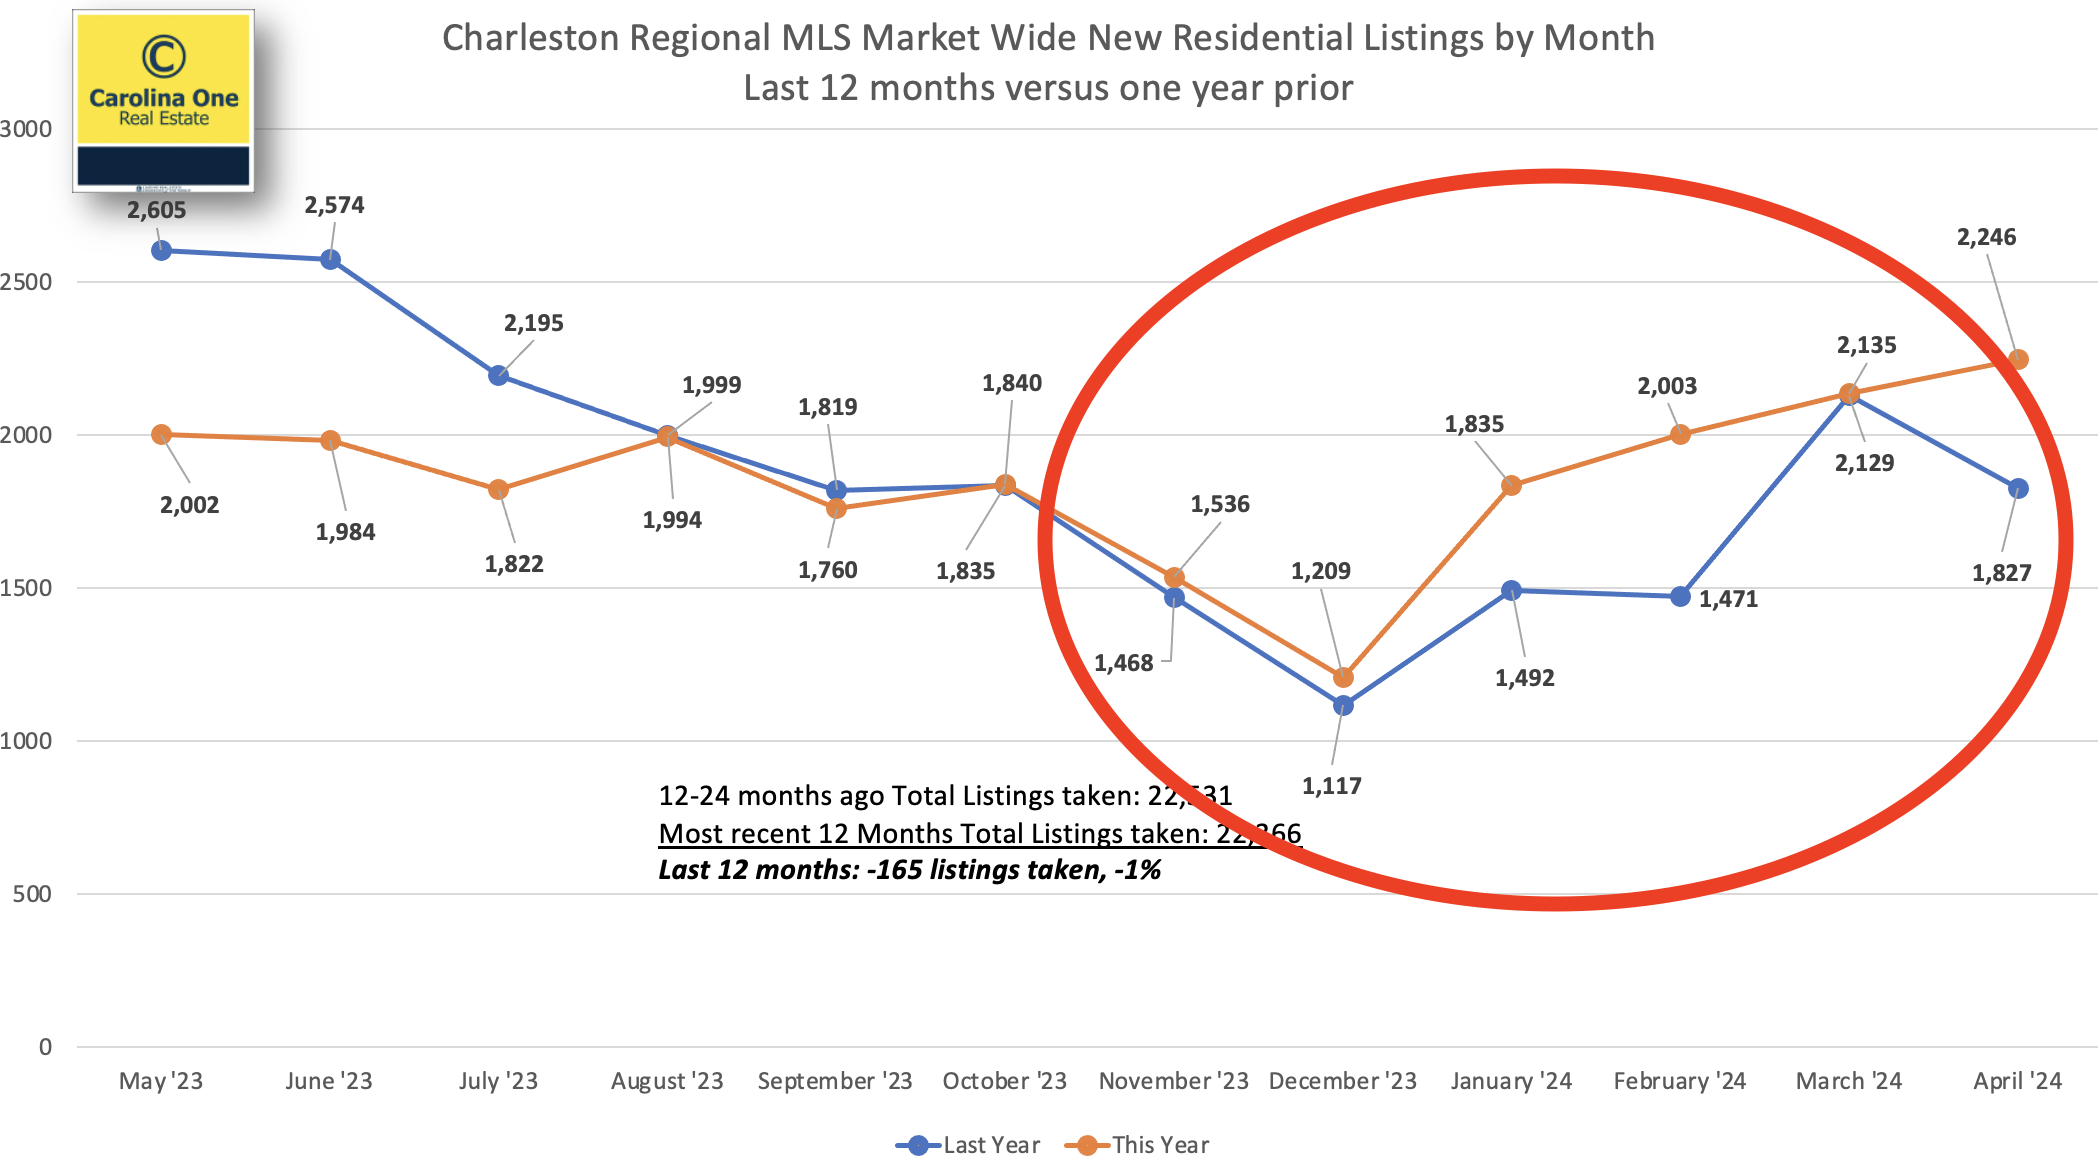
INVENTORY – Approximately 2,000 new listings came online in September 2024, well ahead of last year’s number. Median Days on market was 26.
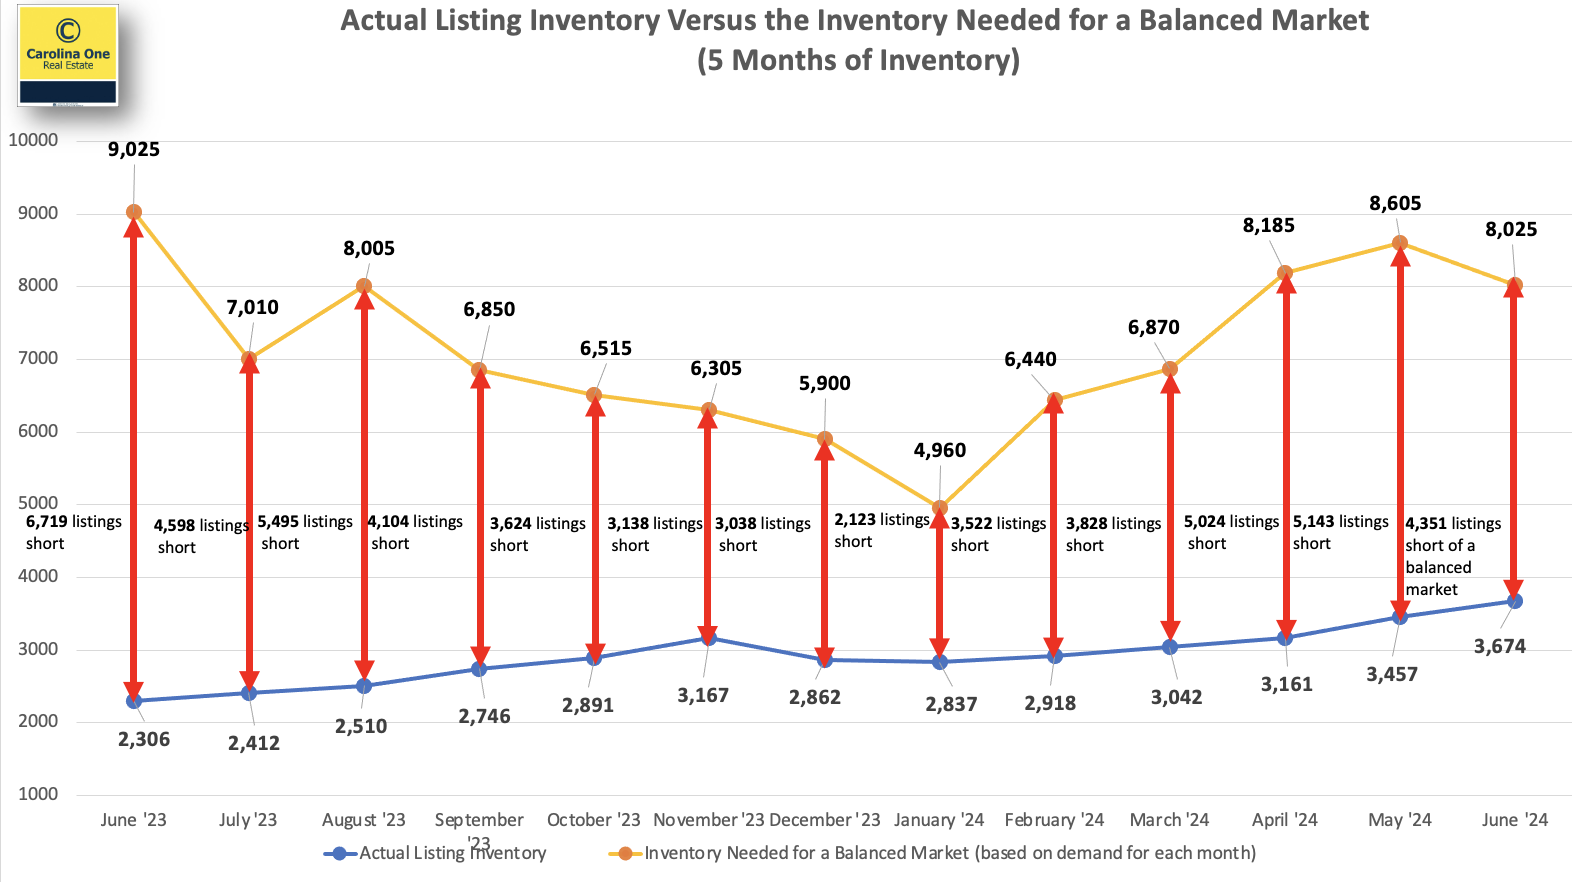
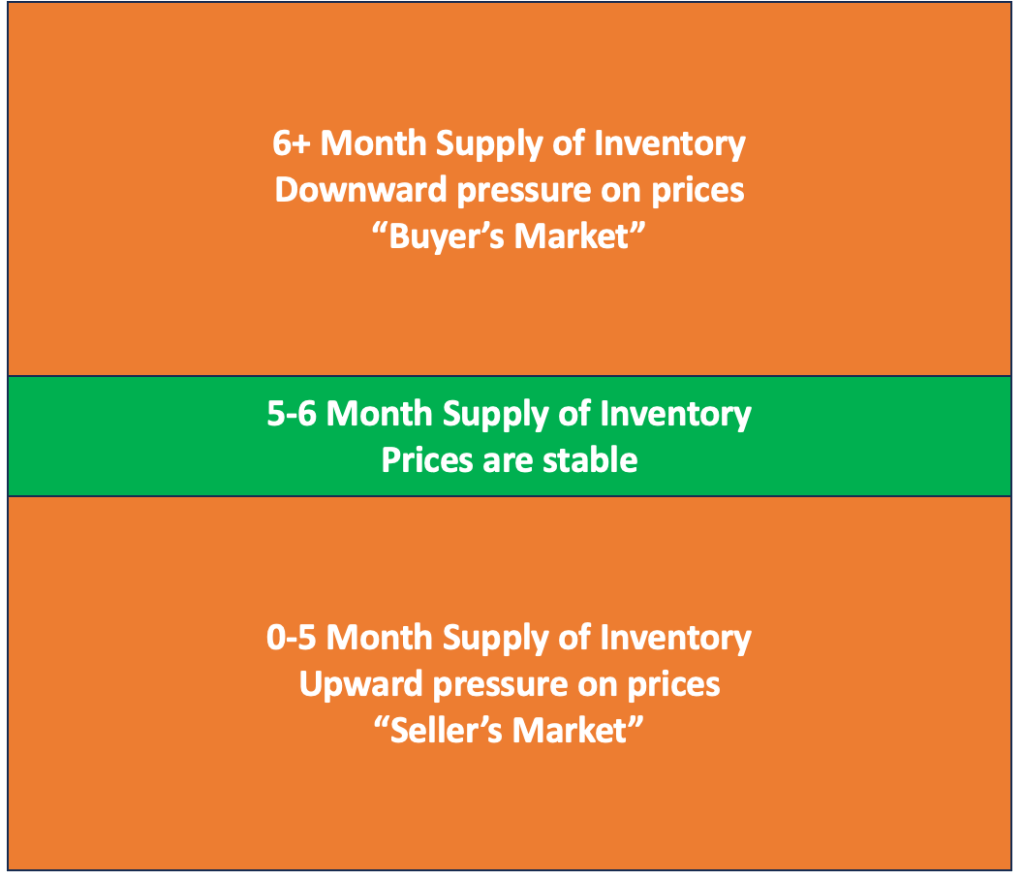
Inventory was at approximately 4,200 listings in September 2024. While this level of inventory is a significant increase, the gap between the number of listings available for sale and the number of listings needed to maintain a balanced market is still substantial. See chart below. We need approximately 2,100 additional listings market wide to achieve a balanced market (5 months of inventory)

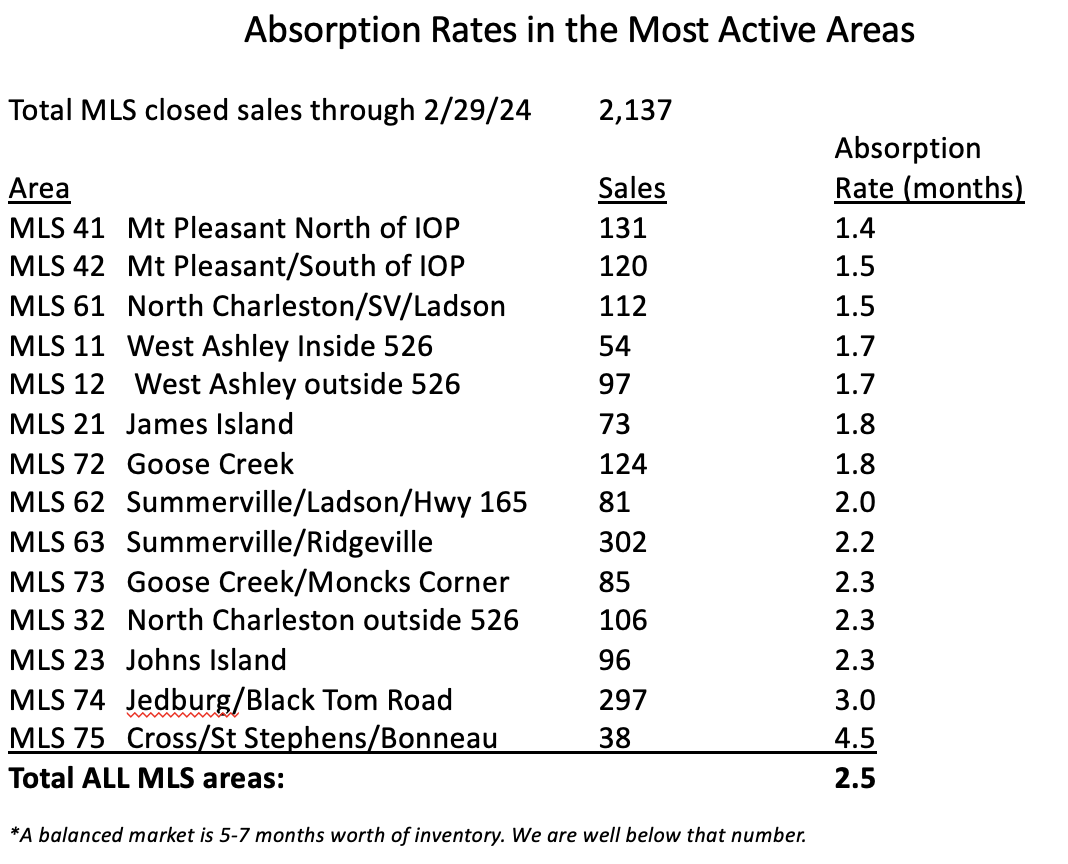
The Charleston market has about ten weeks of inventory as a whole – this can vary by price range and specific location. The most active areas have inventory levels in the 6-10 week range.

NEW CONSTRUCTION – New construction represents 45% of all pending contracts in the MLS and new construction comprises about 36% of the closings.
If you have questions or would like more information, please don’t hesitate to contact me.