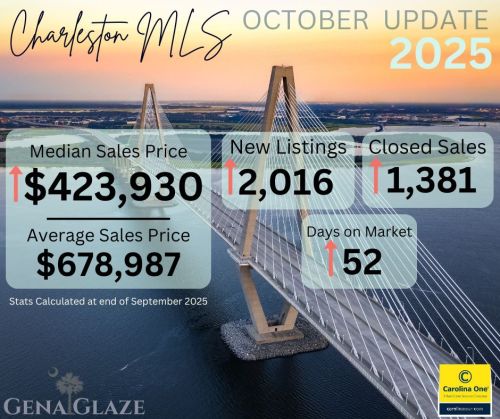
CLOSED SALES – There were 1,381 closed sales in September of 2025, up 8.9% from September of 2024.
PRICE PER SQFT – The average price per sqft for all residential property types was at $296,up 0.7%
SALES PRICE – The median sales price closed out at $423,930 in September 2025, up+3.4% over September of 2024 and the average sales price for August 2025 was $$634,965 The median sales price is still holding steady. It has been in a tight band between 400k and 425K most of the last 3 years.
NEW WRITTEN SALES (Pending) – There were 1,355 new written sales in September 2025, up 0.8% versus September 2024.
INVENTORY – Approximately 2,016 new listings (all property types) came online in September of 2025, which is up 0.1% from September 2024 and the average Days on Market was at 52 (up 20.9%) with 3.7 months of inventory
NEW CONSTRUCTION
New homes represent 23% of the available inventory
18% of all closings in Charleston County were new construction
35% of all closings in Dorchester County were new construction
53% of all closings in Berkeley County were new construction
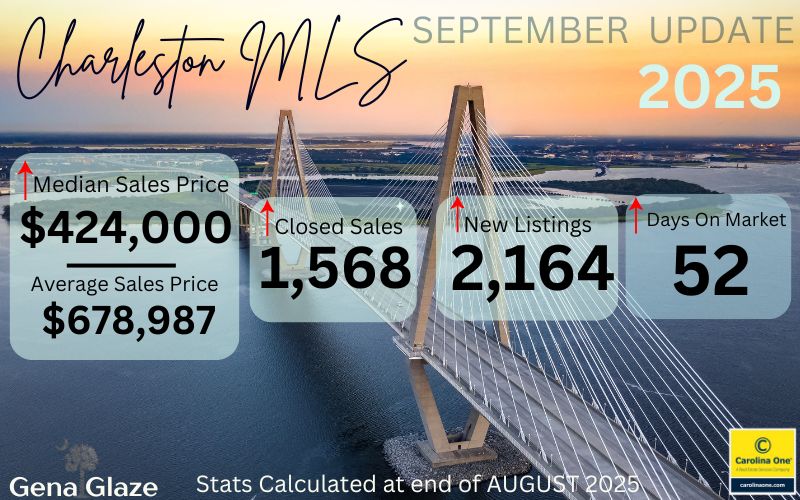
SALES PRICE – The median sales price closed out at $424,000 in August 2025, up+1.2% over August of 2024 and the average sales price for August 2025 was $678,987.
NEW WRITTEN SALES (Pending) – There were 1,568 new written sales in August 2025, up 11.9% versus August 2024. Approximately 480 of these sales were new construction, up+15.7%
CLOSED SALES – There were 1,547 closed sales in August of 2025, up 0.9% from August of 2024. New construction closed sales accounted for 28% of these sales, up +11.6%
INVENTORY – Approximately 2,164 new listings (all property types) came online in August of 2025, which is up +11.1% from August 2024 and the average Days on Market was at 52 (up 23.8%) with 4.1 months of inventory. 581 of August’s new listings were new construction, up 26.3% Previously owned homes (non-new construction) days on market was up+47.1%.
PRICE PER SQFT – The average price per sqft for all residential property types was at $230, up 3.6%.
SHOWINGS PER LISTING – 3.8 | down -7.3%
AUGUST STATS BY COUNTY:
Berkeley – The median sales price was $399,923 | up +0.2% The average sales price was $466,057 and the average days on market was 54. Closed sales (503) were up 0.6%, year over year, 45% of the closed sales were new construction (up 10%)
Charleston – The median sales price was $675,000 | up +12.5%. The average sales price was $1,031,255 and the average days on market was 49 | up+48.5%. Closed sales (652) | up +2.5% New Construction represented 12 % of these sales (up 65.2%).
Dorchester – The median sales price was $372,500 | up +0.5%. The average sales price was $385,433 and the average days on market was 41 | up +32.3%. Closed sales (317) were down -11.7%. New Construction represented 40% of the closed sales.
In January 2020, the median sales price in the Charleston MLS was $284,900. By May 2022, it had risen to $420,000. For most of the last three years, the median sales price has remained in a tight band between $400,000 and $425,000. The Charleston median sales price has now reached $430,000 and surpassed this trend.
Mortgage Rates The 30-year fixed mortgage interest rate was 3.5% in January 2020, making the median price of $284,900 very affordable. Mortgage rates went as low as 2.65% in January of 2021 and eventually peaked at approximately 7.79% in October 2023. These low rates spurred a frenzy of buying activity throughout the Pandemic years. Today, rates are hovering around 6.58% per Freddie Mac. Future rate predictions are mixed – only time can truly tell the trajectory. View rates at Freddie Mac
SALES PRICE – The median sales price closed out at $430,000 in July 2025, up +1.2% over July of 2024 and the average sales price for July 2025 was $620,556
NEW WRITTEN SALES (Pending) – There were 1,577 new written sales in July 2025, up 11% versus July 2024.
CLOSED SALES – There were 1,719 closed sales in July of 2025, up 7.4% from July of 2024.
INVENTORY – Approximately 2,290 new listings (all property types) came online in July 2025, which is up +5% from July 2024 and the average Days on Market was at 45 with 3.6 months of inventory (up 16%). 1712 of July’s new listings were existing homes (non-new construction) this category is at 3.9 months of inventory, up 30%
PRICE PER SQFT – The average price per sqft for all residential property types was at $289 but for resales (non-new construction) it was calculated at $311 / sqft. Despite a fairly stable Median Sale Price, this increase in price per sqft suggests consumers are getting a smaller house for the money (higher Sold $/sqft).
New Construction – New construction represents about 36% of the closings in MLS. In Berkeley County new construction represents 56% of all closed sales.
JULY STATS BY COUNTY:
Berkeley – The median sales price was $395,000 | down -0.3%. The average sales price was $500,965 and the average days on market was 45 | up +21.6%
Charleston – The median sales price was $623,225 | down -1.7%The average sales price was $870,712 and the average days on market was 39 | up +25.8%
Dorchester – The median sales price was $389,500 | up +2.3%. The average sales price was $417,491 and the average days on market was 42 | up +20%
JULY STATS – QUICK VIEW OF MUNICIPLAITIES:
Goose Creek– The median sales price was $314,900 | down -4.3% The average sales price was $317,088 |
Hanahan – The median sales price was $365,000 | down -1.3%, The average sales price was $431,131
Summerville – The median sales price was $399,990 | no change 0.0%, The average sales price $431,092
North Charleston – The median sales price was $346,450 | down -0.4% The average sales price was $392,508
Charleston / West Ashley – The median sales price was $585,000 | down -8.5% The average sales price was $875,381
Mount Pleasant -The median sales price was $955,000 | up +9.1%, The average sales price was $1,127,187
Daniel Island -The median sales price was $1,600,000 | up +7.4% The average sales price was $1,314,444
James Island The median sales price was $338,000 | down -47.6%, The average sales price was $338,000
NEW SALES – Pending – There were 1,898 new written sales in March 2025, up 7.1% versus March of 2024. This is a good indicator of future closed sales.
CLOSED SALES – There were 1,520 closed sales in March of 2025, down 1.1% from March of 2024
SALES PRICE – The Median sales price closed out at $429,000 in March 2025, up +4.6% over March of 2024 and the average sales price for March 2024 was $666,861, up+11.3%.
INVENTORY – Approximately 2,463 new listings came online in March 2025, which is up +13.2% from March 2024 and the average Days on Market was at 52, up +40.5% from March of 2024 with 3.1 months of inventory (up 24%).
PRICE PER SQFT – The median price per sqft closed out a $240 for March of 2025, up 5.7 % from March of 2024. The average of $309, rose +5.5%.
By County:
Berkeley – Median Price per sqft =$203 | up +2.5%, Average price per sqft $232 | up +2.7%
Charleston – Median Price per sqft =$353 | up +8.3%, Average price per sqft $420 | up+4.7%
Dorchester – Median Price per sqft = $198 | up +7.6%, Average price per sqft $201 | up +5.2%
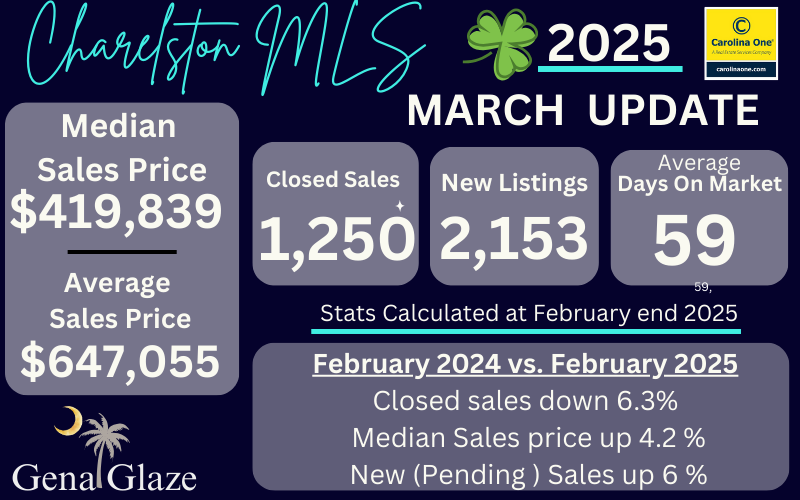
NEW SALES – Pending – There were 1,566 new written sales in February 2025, up 6.0% versus February of 2024.
CLOSED SALES – There were 1,250 closed sales in February of 2025, down 6.3 % from February of 2024
SALES PRICE – The Median sales price closed out at $419,839 in February 2025, up +4.2% over February of 2024 and the average sales price for January 2024 was $647,055, up+12.2%.
INVENTORY – Approximately 2,153 new listings came online in February 2025, which is up +5.2% from February 2024 and the average Days on Market was at 59, up +37.2% from February of 2024 with 3 months of inventory (up 25%)
PRICE PER SQFT – The median price per sqft closed out a $227 for February of 2025, up 6.6%
Closed sales were down year over year but new written sales were up about 6%, which is an indicator of future closed sales. Inventory is improving giving buyers more choice with just modest price gains. Overall, we have positive indicators for the Spring Market!
February 2024 Update for the entire Charleston MLS:
NEW SALES – Pending – There were 1379 new written sales in January 2025, down -6.1% versus January of 2024.
CLOSED SALES – There were 1045 closed sales in January of 2025, up 2.8% from January of 2024
SALES PRICE – The Median sales price closed out at $415,917, up 0.2% over January of 2024 and the average sales price for January 2024 was $631,715
INVENTORY – Approximately 1,907 new listings came online in January 2025, which is up +2.3% from January 2024 and the average Days on Market was at 50, up 28.2% from January of 2024 with 2.7 months of inventory.
Year over Year Review (2023 vs. 2024): Closed sales up 13.7% Median Sales price up 2.3 %
December 2024 stats for the entire Charleston MLS:
NEW SALES – Pending – There were 1106 new written sales in December 2024, a. predictor of future closed sales, which was up 6.3% versus December of 2023. YTD was up 2.4%.
CLOSED SALES – There were 1382 closed sales in December of 2024, up 13.7% from December of 2023 and up a negligible 1.1% YTD, compared to 2024.
SALES PRICE – The Median sales price closed out at $414,296, up 2.30% over December of 2024 and The Year-to-date median sales price was up 4.1% over 2024. The average sales price for December 2024 was $612,457.
INVENTORY – Approximately 1165 new listings came online in December 2024, which is down -6.9% from December 2023 but up YTD 10.8% The market as a whole had approximately 2.6 months of inventory at December’s end with the average Days on Market at 50, up 25% from December of 2023 and up 14% year to date.
NEW SALES – Pending (Ratified contracts) – There were 1,266 new written sales in November 2024, a. predictor of future closed sales, which was up 12% versus November of 2023. YTD was up 3.6% at end of November. However, last week saw 167 properties go under contract market wide, down -15% to the same week last year.
CLOSED SALES – There were 1331 closed sales in November of 2024, up 3.9% from November of 2023 and up a negligible 0.1% YTD, compared to 2023.
SALES PRICE – The Median sales price closed out at $419,000, up 5.4% over November of 2023 and The Year-to-date median sales price was up 4.25% over 2023. The average sales price for Movember 2024 was $611,213. The Median sale price in the Charleston market continues to stay in a tight band between $400k and $425k where it has been for most of the last 30 months- 2 1/2 years!
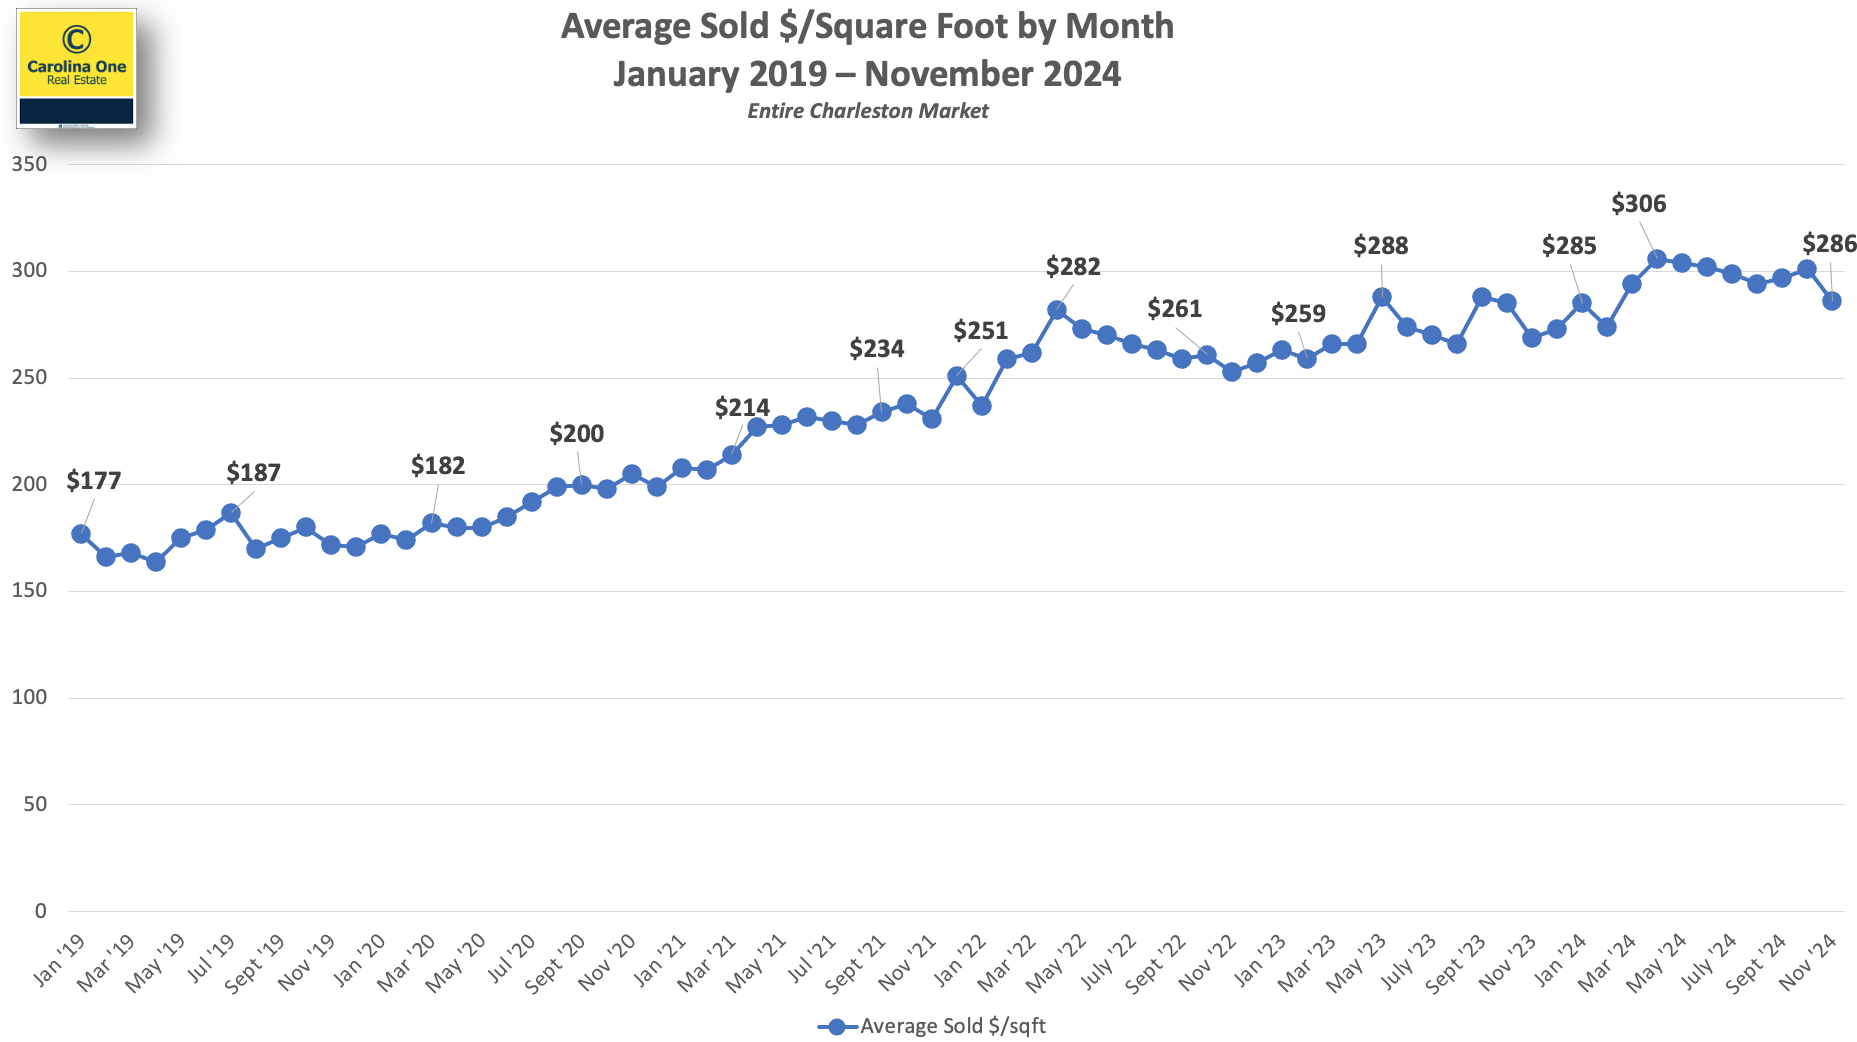
AVERAGE SOLD PRICE PER SQFT
The average price per sqft still remains near an all-time high at approximately $286 /sqft
INVENTORY – Approximately 1581 new listings came online in November 2024, which is up 0.6% from November 2023 and up YTD 11.7%
We still need roughly 2,500 additional listings market wide to achieve a balanced market (5 months of inventory)
The market as a whole has approximately 2.6 months of inventory with the Days on Market at 29. See absorption rate by area below:
NEW CONSTRUCTION – New construction represents 49% of all pending contracts in the MLS and new construction comprises approximately 36% of the closings.
FORECLOSURES AND SHORT SALES – Represent a combined 0.7% of all available listings
If you have questions or have a real estate need, please don’t hesitate to contact me!
NEW SALES – Pending (Ratified contracts) – There were 1,393 new written sales in October 2024, a predictor of future closed sales, which was up 2% versus October of 2023. YTD was down -4%
However, Last week 242 properties went under contract market wide, which was up +16% compared to the same week last year.
CLOSED SALES – FLAT – There were 1,354 closed sales in October of 2024, down a negligible -0.7% from October 2023 and down -0.4% YTD, compared to 2023.
SALES PRICE – The Median sales price closed out at $415,685, up 3% over October of 2023 and The Year-to-date median sales price was up 4.25% over 2023. The average sales price for October 2024 was $644,758. The Median sale price in the Charleston market continues to stay in a tight band between $400k and $425k where it has been for most of the last 27+ months.
AVERAGE SOLD PRICE PER SQFT
The average price per sqft still remains near an all-time high at approximately $301 /sqft
INVENTORY – Approximately 1961 new listings came online in October 2024, which is up 4% from October 2023 and Third quarter Inventory levels were up 12.6% over 2023.
There were approximately 2.7 months of Inventory calculated in October 2024, with the median Days on Market at 25, up 56.2% from October 2023 and the median days on market up 46.7% YTD.
We still need additional listings market wide to achieve a balanced market of 5 months of inventory.
Absorption rate by Area
NEW CONSTRUCTION – New construction represents 48% of all pending contracts in the MLS and new construction comprises approximately 36% of the closings.
FORECLOSURES AND SHORT SALES – have declined even further to a combined 0.7% of all available listings This market continues to be basically nonexistent and there are very few “newly distressed” properties in the pipeline.
MM+ We are roughly double the monthly pre-pandemic sales levels of over Million dollar plus properties. This market segment remains robust.
If you have questions or have a real estate need, please don’t hesitate to contact me!