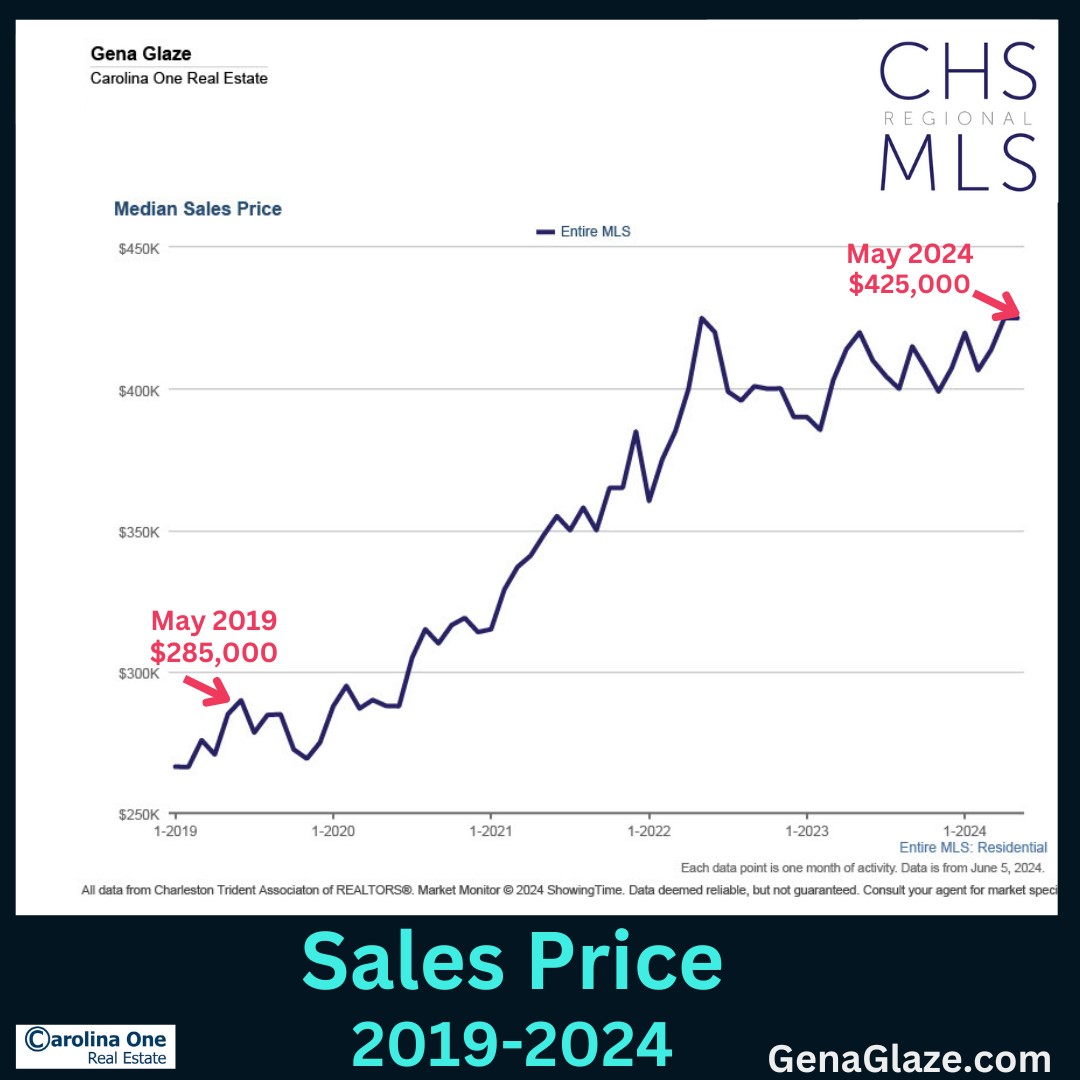
At the end of May 2024, the median sales price closed out in the Charleston MLS at $425,000 and Median Days on Market was 12.
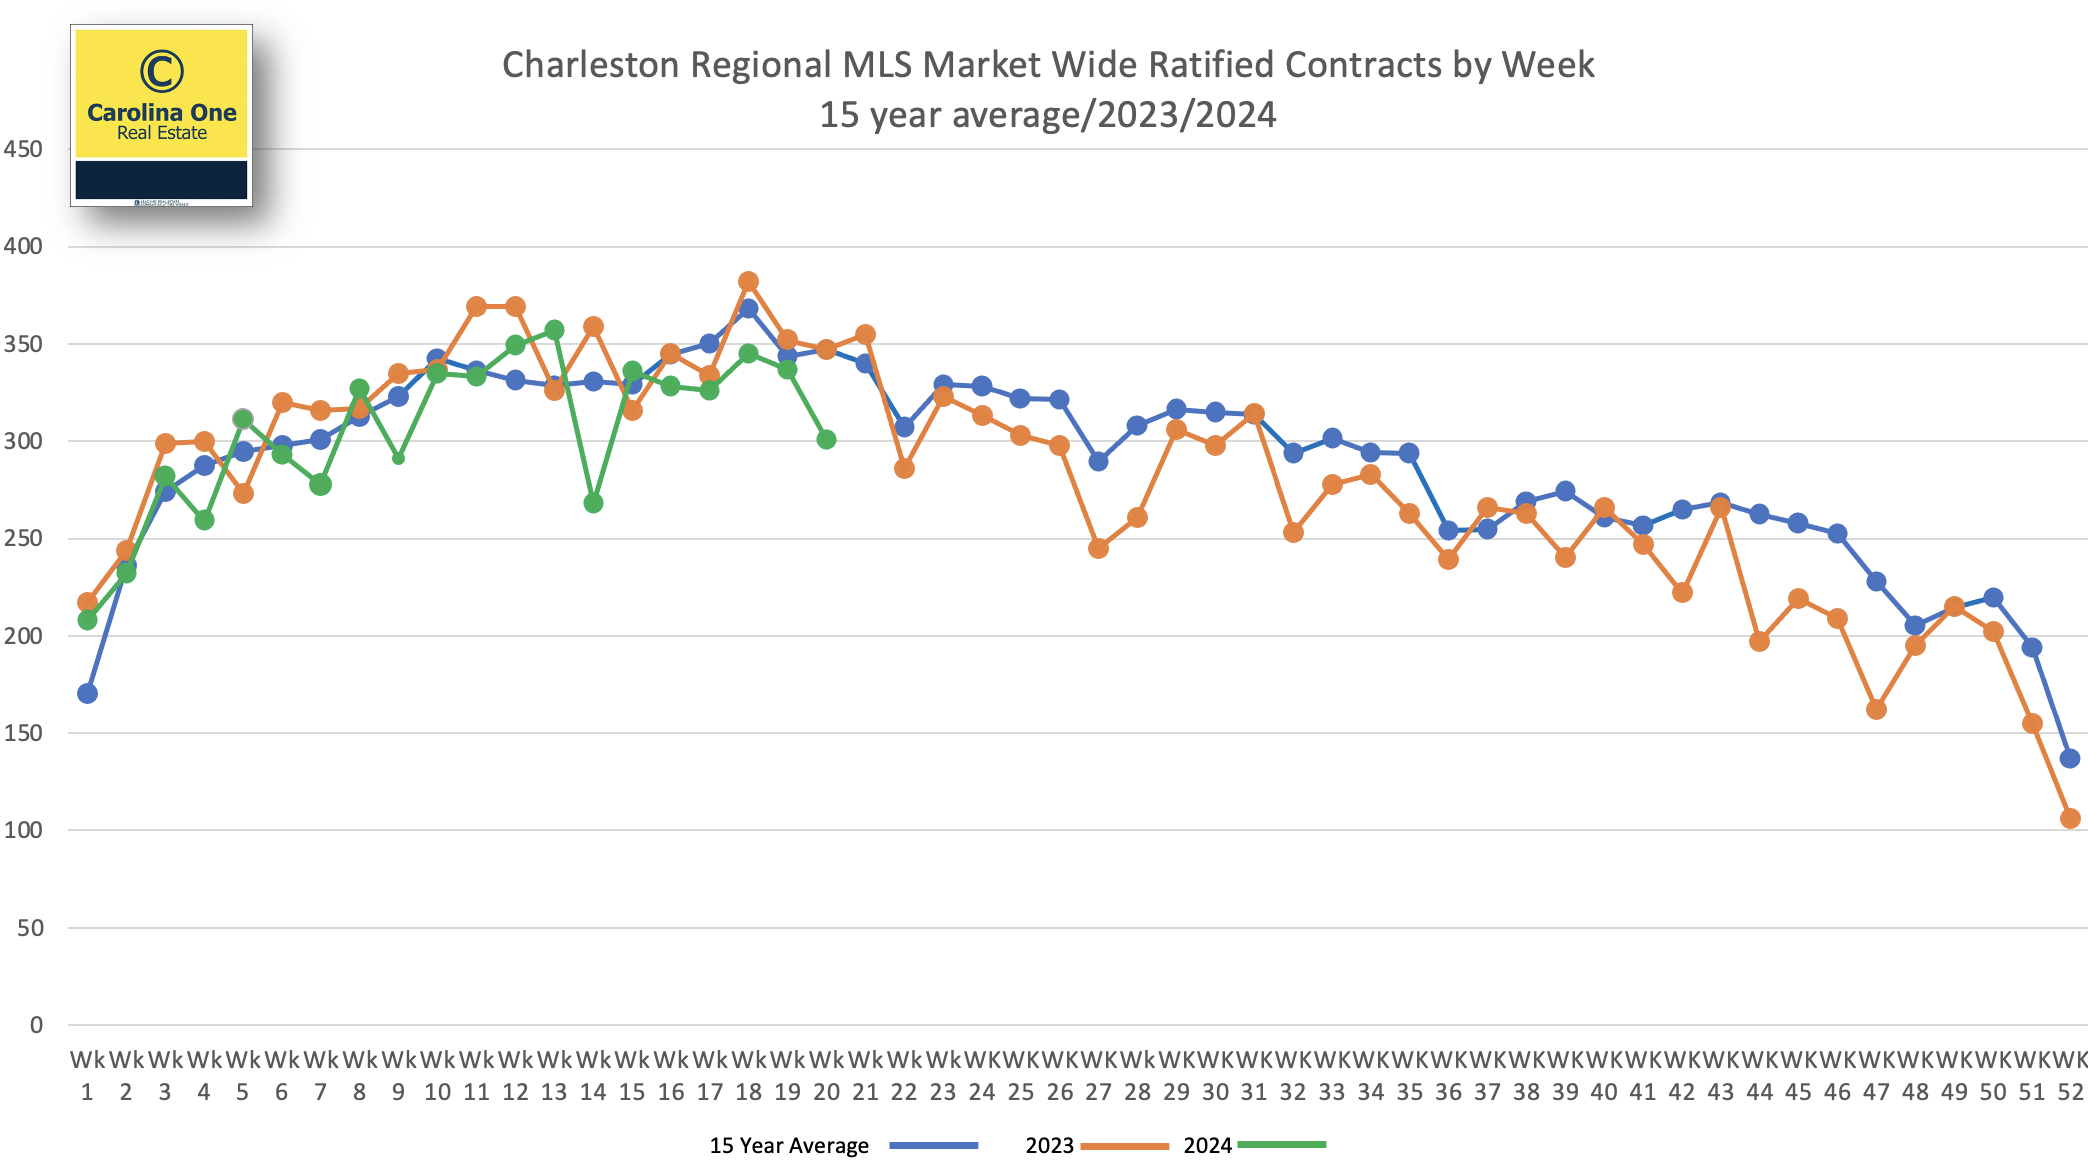
The current level of demand, although down 40% from 2021, is pacing around the 15 year average and is happening when interest rates are the highest that they have been in 20-25 years . Further, prices are hovering at their record highs and have been for aproximately18 months. This means that affordability is more challenging than it has been for the last few decades (high prices + high rates) and yet sales sit at a historically appropriate level in terms of units. This suggests that the consumer wants and/or needs housing to the point where they are willing to deal with affordability issues – at least for now.
The chart below shows this year’s number of ratified contracts market wide by week (green), last year’s number (orange) and the 15 year average (blue). As you can see, the green line has tracked very closely with the blue line with only two weeks well below the 15 year average and one week well above the 15 year average.
Supply
When a life change occurs (Marriage, death, additions to a family, new job, etc) frequently, housing needs change which often leads to a new listing entering the housing market.
Over the last few years, we’ve seen a pause in this cycle as interest rates have risen rapidly from the 3 percent range into the mid 7 percent range. Homeowners who have a mortgage in place at a very low interest rate are reluctant to part with that low rate and move into a home, with a higher rate, that may better suits their needs.
According to ICE Mortgage Technology, over 90% of the mortgages in the United States have a mortgage rate under 6%.
See below from ICE:

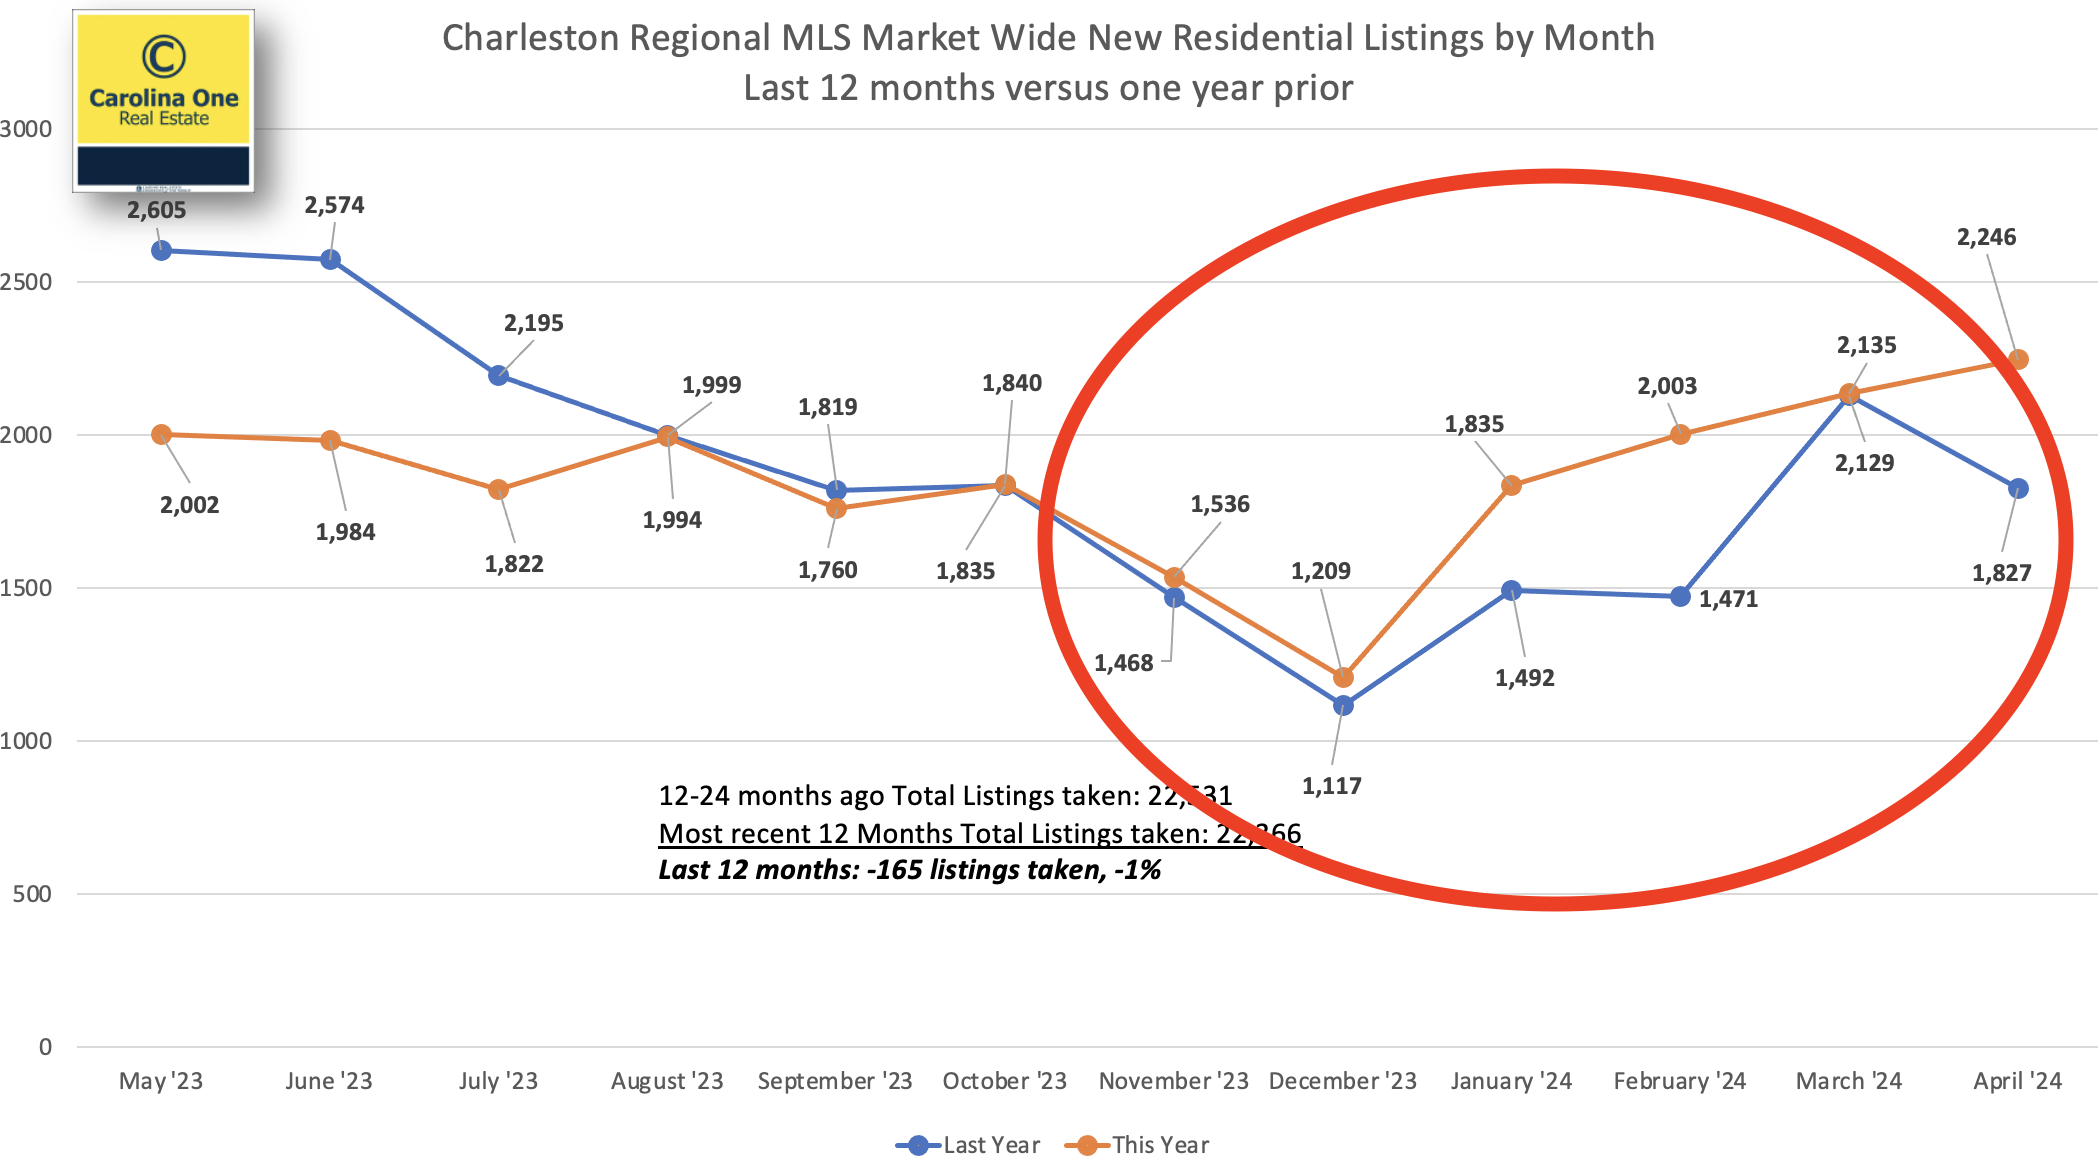
Change still happens in people’s lives and homeowners can only hold back for so long. They will eventually list their homes (move) when the life circumstances dictate the need is great, despite the rate differential. We have been seeing this happen.
This trend started in November of 2023. In the chart below, the orange line shows listings taken in the most recent 12 months and the blue line shows the prior 12 months. You’ll note that, inside the red circle (November onward), new listings taken have outpaced the prior year every month.
A Balanced Market
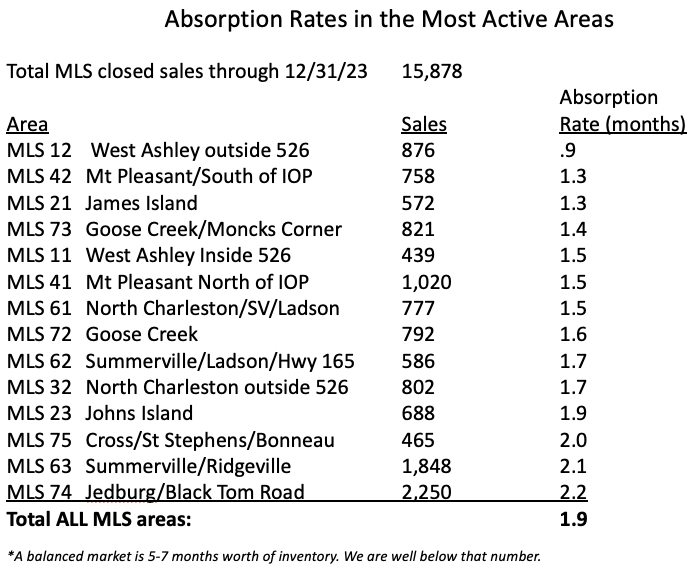
A “balanced market” is generally considered to be when we have around 5 months of inventory, meaning that the current level of listings, if no new properties enter the market, would sell down to zero in five months based on current sales levels. On average, it would take five months (150 days) to sell a home.
Months of inventory” is simply a way of measuring supply and demand, which of course is what drives pricing.
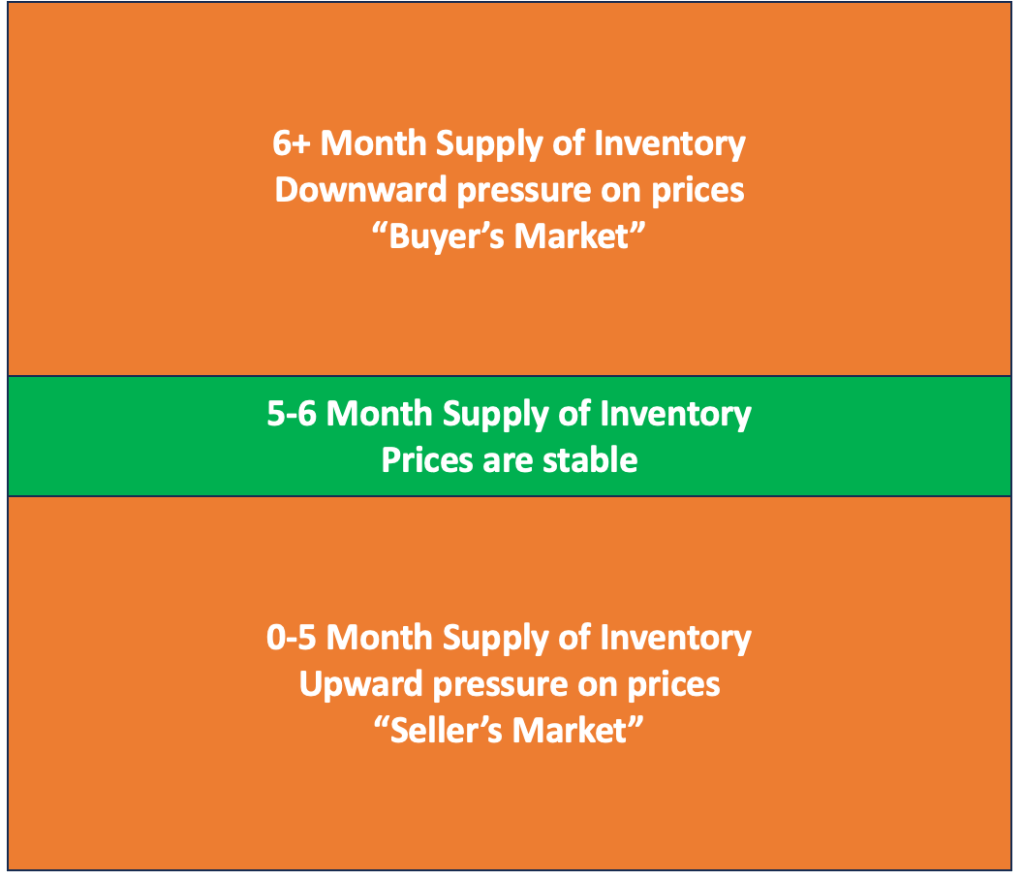
- At roughly five months of inventory, home prices stabilize
- If we have less than five months of inventory, prices generally increase
- If we have more than 5-6 months of inventory, prices generally soften
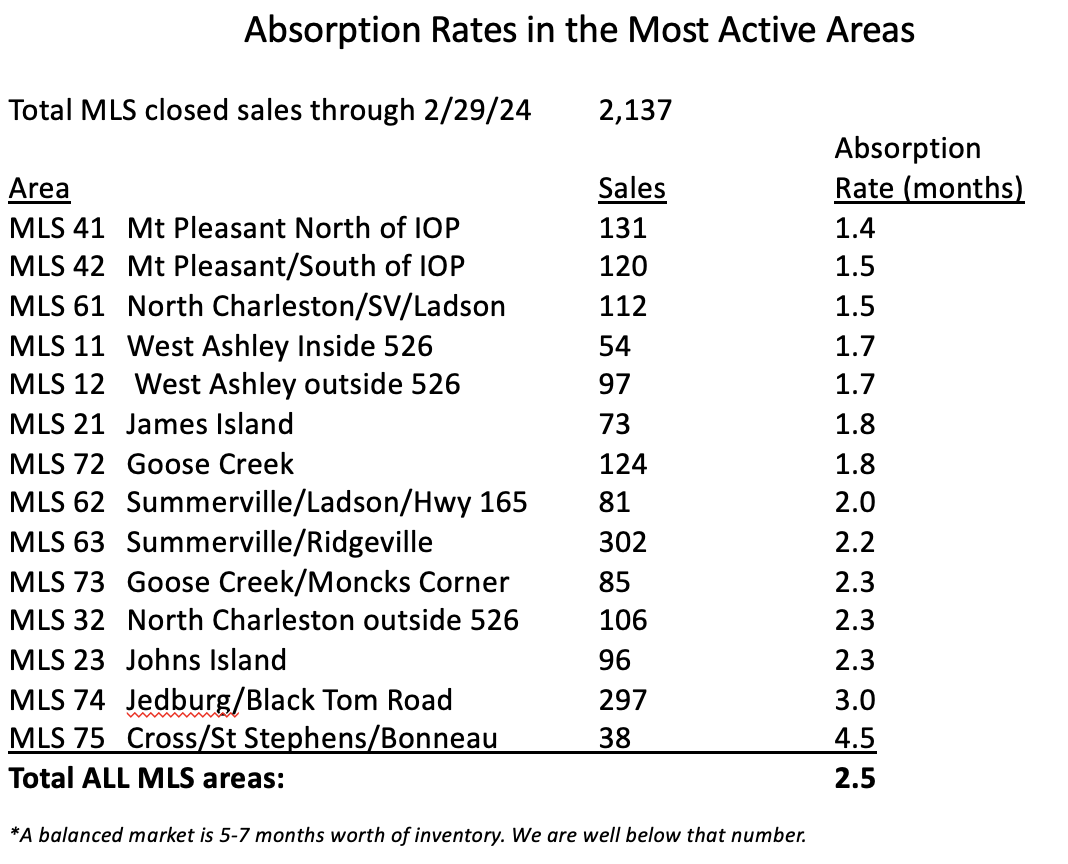
Where is the Charleston housing market’s month’s of supply currently?
At May’s end MLS stats reflected approximately 2.6 month’s supply of inventory, still leaning toward a Seller’s market.
Below is to illustrate the gap (red arrow) between the inventory that we have (blue line) and the inventory that we need in order to have a balanced market (yellow line):

What does this mean?
- For now, we don’t have enough inventory to meet demand (although inventory is slowly building)
- Too little inventory for demand means that there is good support for current prices and perhaps a little more room for prices to grow
Worth noting:
- Over the last 4 years or so, the market has been so imbalanced in favor of sellers that we now often see listing agents and/or sellers get uncomfortable/nervous/start to panic after a mere week or two on the market without a sale
- What we’ve experienced over the last few years has skewed expectations to the point where favorable selling conditions that aren’t quite a “hot” market feels like things are “slow”