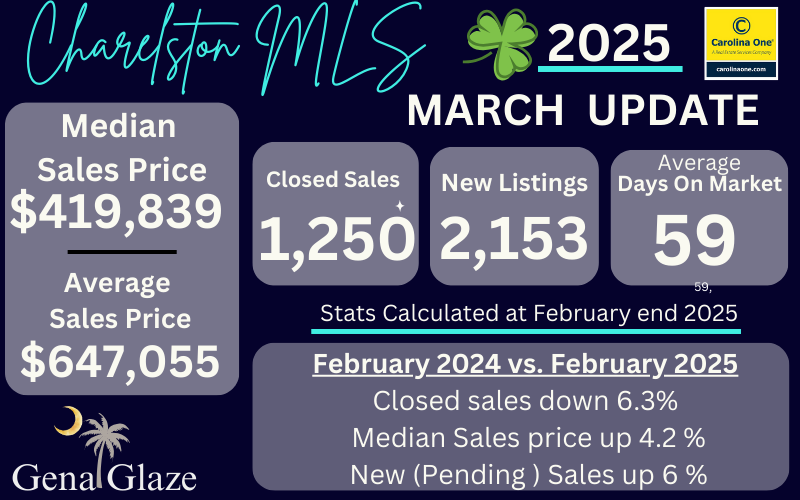
NEW SALES – Pending – There were 1,566 new written sales in February 2025, up 6.0% versus February of 2024.
CLOSED SALES – There were 1,250 closed sales in February of 2025, down 6.3 % from February of 2024
SALES PRICE – The Median sales price closed out at $419,839 in February 2025, up +4.2% over February of 2024 and the average sales price for January 2024 was $647,055, up+12.2%.
INVENTORY – Approximately 2,153 new listings came online in February 2025, which is up +5.2% from February 2024 and the average Days on Market was at 59, up +37.2% from February of 2024 with 3 months of inventory (up 25%)
PRICE PER SQFT – The median price per sqft closed out a $227 for February of 2025, up 6.6%
Closed sales were down year over year but new written sales were up about 6%, which is an indicator of future closed sales. Inventory is improving giving buyers more choice with just modest price gains. Overall, we have positive indicators for the Spring Market!
February 2024 Update for the entire Charleston MLS:
NEW SALES – Pending – There were 1379 new written sales in January 2025, down -6.1% versus January of 2024.
CLOSED SALES – There were 1045 closed sales in January of 2025, up 2.8% from January of 2024
SALES PRICE – The Median sales price closed out at $415,917, up 0.2% over January of 2024 and the average sales price for January 2024 was $631,715
INVENTORY – Approximately 1,907 new listings came online in January 2025, which is up +2.3% from January 2024 and the average Days on Market was at 50, up 28.2% from January of 2024 with 2.7 months of inventory.
Year over Year Review (2023 vs. 2024): Closed sales up 13.7% Median Sales price up 2.3 %
December 2024 stats for the entire Charleston MLS:
NEW SALES – Pending – There were 1106 new written sales in December 2024, a. predictor of future closed sales, which was up 6.3% versus December of 2023. YTD was up 2.4%.
CLOSED SALES – There were 1382 closed sales in December of 2024, up 13.7% from December of 2023 and up a negligible 1.1% YTD, compared to 2024.
SALES PRICE – The Median sales price closed out at $414,296, up 2.30% over December of 2024 and The Year-to-date median sales price was up 4.1% over 2024. The average sales price for December 2024 was $612,457.
INVENTORY – Approximately 1165 new listings came online in December 2024, which is down -6.9% from December 2023 but up YTD 10.8% The market as a whole had approximately 2.6 months of inventory at December’s end with the average Days on Market at 50, up 25% from December of 2023 and up 14% year to date.
NEW SALES – Pending (Ratified contracts) – There were 1,266 new written sales in November 2024, a. predictor of future closed sales, which was up 12% versus November of 2023. YTD was up 3.6% at end of November. However, last week saw 167 properties go under contract market wide, down -15% to the same week last year.
CLOSED SALES – There were 1331 closed sales in November of 2024, up 3.9% from November of 2023 and up a negligible 0.1% YTD, compared to 2023.
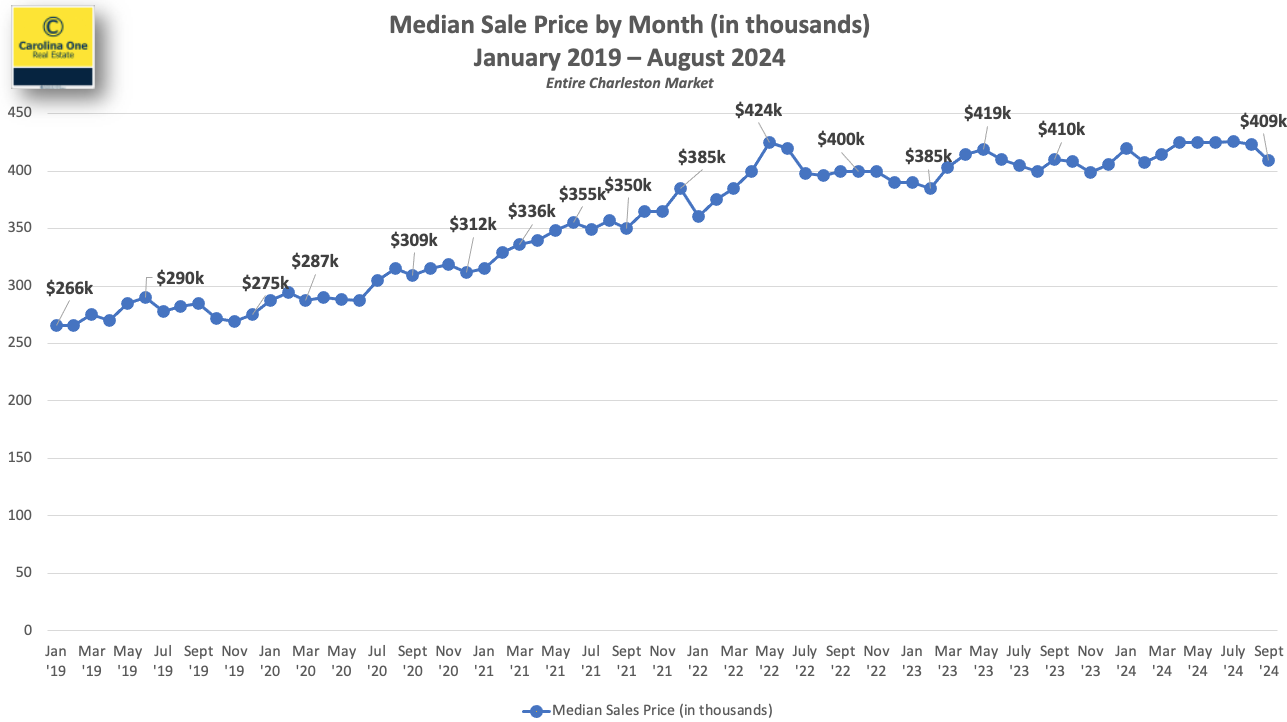
SALES PRICE – The Median sales price closed out at $419,000, up 5.4% over November of 2023 and The Year-to-date median sales price was up 4.25% over 2023. The average sales price for Movember 2024 was $611,213. The Median sale price in the Charleston market continues to stay in a tight band between $400k and $425k where it has been for most of the last 30 months- 2 1/2 years!
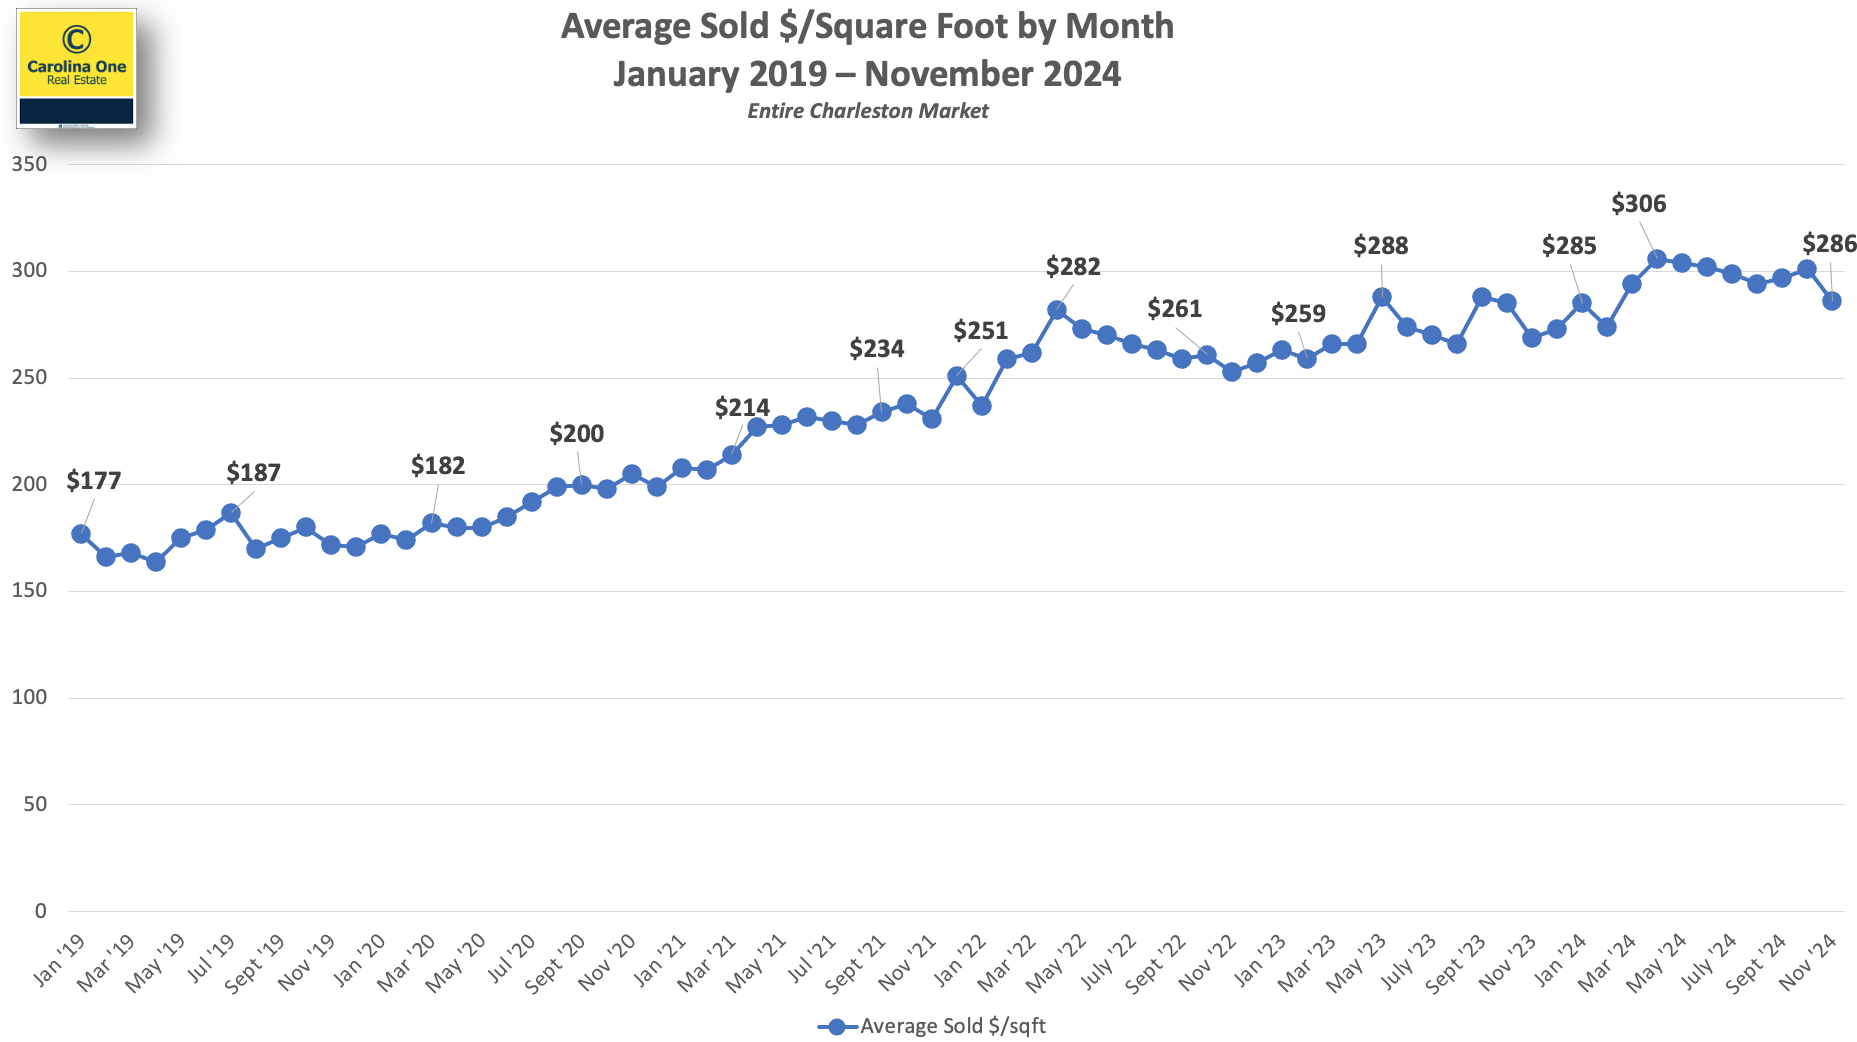
AVERAGE SOLD PRICE PER SQFT
The average price per sqft still remains near an all-time high at approximately $286 /sqft
INVENTORY – Approximately 1581 new listings came online in November 2024, which is up 0.6% from November 2023 and up YTD 11.7%
We still need roughly 2,500 additional listings market wide to achieve a balanced market (5 months of inventory)
The market as a whole has approximately 2.6 months of inventory with the Days on Market at 29. See absorption rate by area below:
NEW CONSTRUCTION – New construction represents 49% of all pending contracts in the MLS and new construction comprises approximately 36% of the closings.
FORECLOSURES AND SHORT SALES – Represent a combined 0.7% of all available listings
If you have questions or have a real estate need, please don’t hesitate to contact me!
NEW SALES – Pending (Ratified contracts) – There were 1,393 new written sales in October 2024, a predictor of future closed sales, which was up 2% versus October of 2023. YTD was down -4%
However, Last week 242 properties went under contract market wide, which was up +16% compared to the same week last year.
CLOSED SALES – FLAT – There were 1,354 closed sales in October of 2024, down a negligible -0.7% from October 2023 and down -0.4% YTD, compared to 2023.
SALES PRICE – The Median sales price closed out at $415,685, up 3% over October of 2023 and The Year-to-date median sales price was up 4.25% over 2023. The average sales price for October 2024 was $644,758. The Median sale price in the Charleston market continues to stay in a tight band between $400k and $425k where it has been for most of the last 27+ months.
AVERAGE SOLD PRICE PER SQFT
The average price per sqft still remains near an all-time high at approximately $301 /sqft
INVENTORY – Approximately 1961 new listings came online in October 2024, which is up 4% from October 2023 and Third quarter Inventory levels were up 12.6% over 2023.
There were approximately 2.7 months of Inventory calculated in October 2024, with the median Days on Market at 25, up 56.2% from October 2023 and the median days on market up 46.7% YTD.
We still need additional listings market wide to achieve a balanced market of 5 months of inventory.
Absorption rate by Area
NEW CONSTRUCTION – New construction represents 48% of all pending contracts in the MLS and new construction comprises approximately 36% of the closings.
FORECLOSURES AND SHORT SALES – have declined even further to a combined 0.7% of all available listings This market continues to be basically nonexistent and there are very few “newly distressed” properties in the pipeline.
MM+ We are roughly double the monthly pre-pandemic sales levels of over Million dollar plus properties. This market segment remains robust.
If you have questions or have a real estate need, please don’t hesitate to contact me!
NEW SALES – Pending (Ratified contracts) – New Written sales, a predictor of future closed sales, were down market wide -1% in September of ’24 versus September of ’23. However, last week 255 properties went under contract market wide, +3% from the same week last year. This is a strong and seasonally appropriate number.
CLOSED SALES – Year To date closed sales were at 13,390 at the end of September 2024. A very small difference from the 13,438 at the same time in 2023.
Third Quarter of 2024 closed sales were at 4,396, which is down 3 percent from 2023 (which had 4,510). As a reference, there were 5018 closed sales in 2022.
There were 1,254 closed sales in September 2024 which is down 11 percent from the 1,411 that we saw in September of 2023. Again, as a reference, there were 1,573 closed sales in September of 2022
SALES PRICE – The Median sale price closed out at $409,085 in September 2024. The Charleston market continues to stay in a tight band between $400k and $425k where it has been for most of the last 27+ months. The average sales price was $627,254 in September 2024.
AVERAGE SOLD PRICE PER SQFT
The median sales price has remained in a tight band but the average price per sqft remains near an all-time high, well above one year ago. Consumers are getting a smaller house for the money. Essentially, homes are continuing to appreciate despite a stable Median Sale Price.
INVENTORY – Approximately 2,000 new listings came online in September 2024, well ahead of last year’s number. Median Days on market was 26.
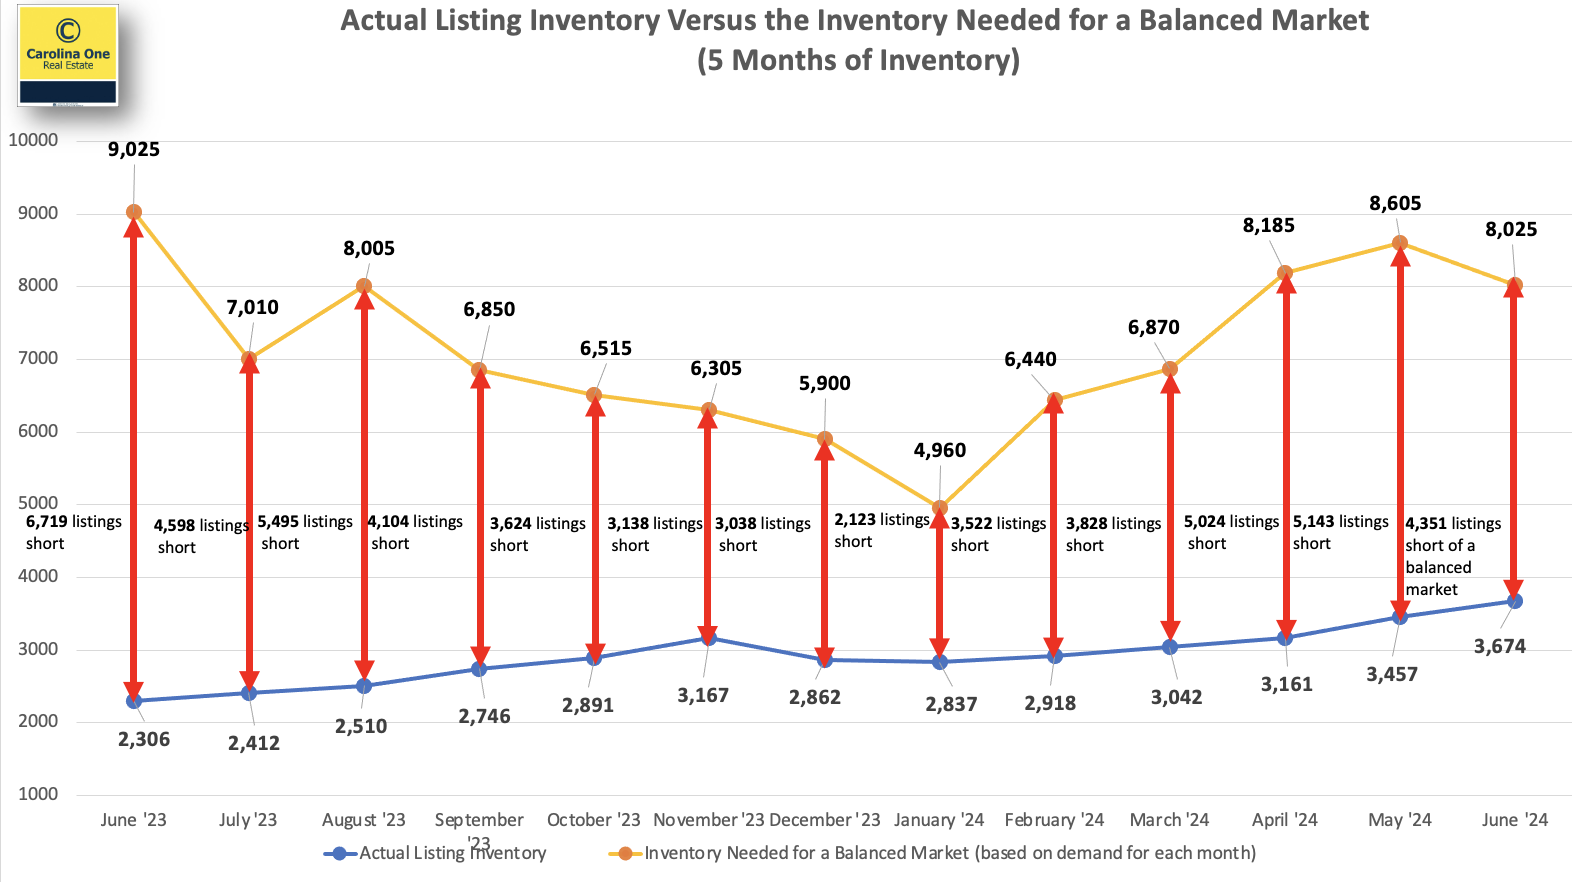
Inventory was at approximately 4,200 listings in September 2024. While this level of inventory is a significant increase, the gap between the number of listings available for sale and the number of listings needed to maintain a balanced market is still substantial. See chart below. We need approximately 2,100 additional listings market wide to achieve a balanced market (5 months of inventory)
The Charleston market has about ten weeks of inventory as a whole – this can vary by price range and specific location. The most active areas have inventory levels in the 6-10 week range.
NEW CONSTRUCTION – New construction represents 45% of all pending contracts in the MLS and new construction comprises about 36% of the closings.
If you have questions or would like more information, please don’t hesitate to contact me.
NEW SALES – Pending (Ratified contracts) Down -6% in August of ’24 versus August of ’23. See Chart below – The orange line represents ratified contracts by week last year…the green line is this year…and the blue line is the 15 year average for each week. Follow the green line below.
*written sales (ratified contracts) reflect buyer sentiment and predict the number of closed sales in a month or two as ratified contracts typically close within 4-8 weeks.
CLOSED SALES 149I homes closed in August 2024 down -7.9% from August of 2023
MEDIAN SALES PRICE The Median sale price in the Charleston market $422,670, up 5.67% from August 2023 and has continued to stay in a tight band between $400k and $425k for most of the last 26+ months.
The Average sales price was $617,873, up 11.54% from August of 2024
AVERAGE SOLD PRICE PER SQFT While the median sales price is remaining in a tight band, The Average Sold Dollar per sqft remains near an all-time high, at about $291 / SQFT. This means that homes are continuing to appreciate despite a stable median Sale Price
SEASONAL STATS The seasonal surge in median price that is typically experienced in the spring/summer market trended about 6% above last year’s seasonal surge, suggesting that the current pricing in our market has a solid base and given low inventory levels relative to sales, could mean that additional price gains lie ahead.
*Please note that all real estate is local; some local submarkets where there is a lot of new construction in close proximity and similarly priced are seeing prices advance more slowly.
INVENTORY Active Inventory was at approximately 4,000 listings in August, which is a significant increase over the 1,035 listing “floor” that we set in February of 2022. However, we need approximately 3,500 additional listings, market wide, to achieve a balanced market (5 months of inventory). The gap between the number of listings available for sale and the number of listings needed to maintain a balanced market is still substantial. see chart below
Approximately 1,928 new listings came online in August, well ahead of last year’s numbers, which should help drive sales later this year.
The Charleston market has about ten weeks of inventory as a whole, still leaning toward a seller’s market (this varies by price range and specific location). The most active areas have inventory levels are in the 4-6 week range.
NEW CONSTRUCTION New construction represents 45% of all pending contracts in the MLS and comprises about 36% of the closings
FORECLOSURES AND SHORT SALES Foreclosures and Short Sale combined are at 0.9% of all available listings.This is down from 1.8% of all available listings on 1/1/2020. This are very few “newly distressed” properties in the pipeline.
Record home equity is driving the historically low delinquency rate along with high levels of employment. Homeowners do not want to lose their equity.
MILLION DOLLAR PLUS MARKET We are at roughly double the monthly pre-pandemic sales levels of $1MM+ properties. This market segment remains robust.
If you would like more market information or have a real estate need, don’t hesitate to contact me!
The Real estate market is still active and the median sales price continues to remain steady – It has been roughly between 400k and 425K for over 24 months. Inventory is still below what is needed for a balanced market, but new listings are rising. Below are July 2024 calculations.
PRICE: The median sales price was $425,473, up about 5% from July 2023. The average sales price was $658,344. The median price per sqft was $228 and the average was $300 / sqft
NEW SALES: Pending sales for July were at 2,139 up 15.3 from July 2023
SUPPLY: There were 2139 New Listings in July 2024 – up 15.6%. The median days on market was 20, with approximately 2.9 months of inventory. Still under the 5 months of inventory recommended for a balanced market.
CLOSED SALES: 382 properties closed in July 2024 which is up 10 percent from July of 2023.
As we move into the second half of 2024, here’s what experts say you should expect for home prices, mortgage rates, and home sales.
Home Prices Are Expected To Climb Moderately
Home prices are forecasted to rise at a more normal pace. The graph below shows the latest forecasts from seven of the most trusted sources in the industry:
The reason for continued appreciation? The supply of homes for sale. Jessica Lautz, Deputy Chief Economist at the National Association of Realtors (NAR), explains:
“One thing that seems to be pretty solid is that home prices are going to continue to go up, and the reason is that we don’t have housing inventory.”
While inventory is up compared to the last couple of years, it’s still low overall. And because there still aren’t enough homes to go around, that’ll keep upward pressure on prices.
If you’re thinking of buying, the good news is you won’t have to deal with prices skyrocketing like they did during the pandemic. Just remember, prices aren’t expected to drop. They’ll continue climbing, just at a slower pace.
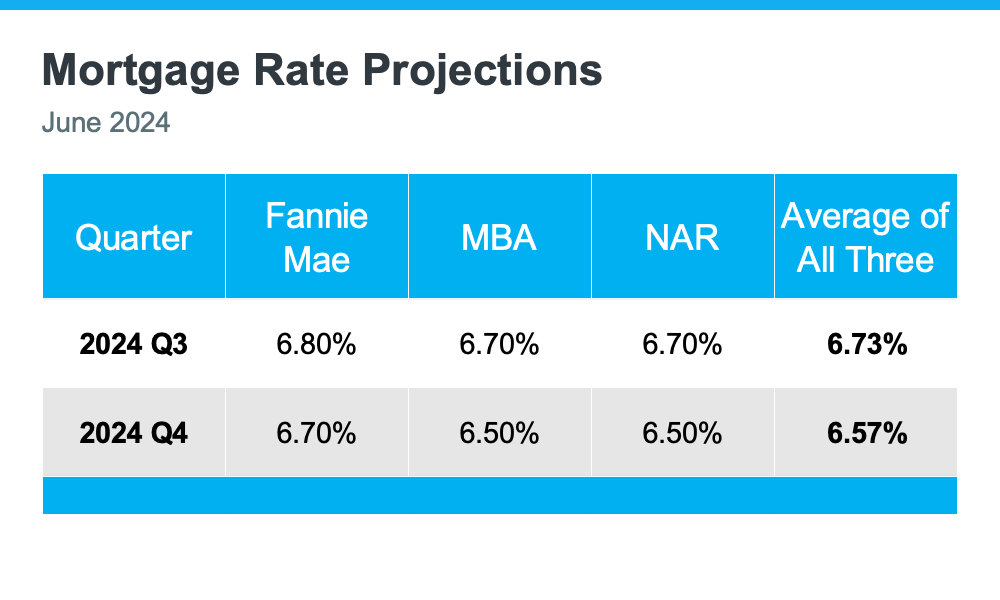
Mortgage Rates Are Forecast To Come Down Slightly
One of the best pieces of news for both buyers and sellers is that mortgage rates are expected to come down a bit, according to Fannie Mae, the Mortgage Bankers Association (MBA), and NAR (see chart below):
When you buy, even a small drop in mortgage rates can make a big difference in your monthly payments. For sellers, lower rates will bring more buyers back into the market, which can help you sell faster and potentially at a higher price.
Home Sales Are Projected To Hold Steady
For 2024, the number of home sales will be about the same as last year and may even rise slightly. The graph below compares the 2024 home sales forecasts from Fannie Mae, MBA, and NAR to the 4.8 million homes that sold last year:
The average of the three forecasts is about 5 million sales in 2024 – a small increase from 2023. Lawrence Yun, Chief Economist at NAR, explains why:
“Job gains, steady mortgage rates and the release of inventory from pent-up home sellers will lead to more sales.”
With more inventory available and mortgage rates expected to go down, a few more homes are expected to be sold this year compared to last year.
The average of the three forecasts is about 5 million sales in 2024 – a small increase from 2023. Lawrence Yun, Chief Economist at NAR, explains why:
“Job gains, steady mortgage rates and the release of inventory from pent-up home sellers will lead to more sales.”
With more inventory available and mortgage rates expected to go down, a few more homes are expected to be sold this year compared to last year. This means more people will be able to move.
If you have considered buying or selling, feel free to contact me anytime! I have 25 years’ experience and can help you navigate today’s market to reach your goals.
The Median sales Price at the end of June in the Charleston MLS was $425,000 and the average sales price $646,792
The Median sale price in the Charleston market continues to stay in a tight band between $400k and $425k where it has been for most of the last 24+ months. In June, the Median Sale Price matched it’s all time high of approximately $425,000 – has remained at that level for three consecutive months.
The seasonal surge in median is trending about 3% above last year’s seasonal surge, suggesting that the current pricing in our market has a solid base for additional price gains.
WRIITEN SALES
Written sales market-wide finished +3% in June of ’24 versus June of ’23, the first year-over-year increase in 2024. This is an indicator of future sales.
Last week saw 281 properties go under contract market-wide.
The orange line represents ratified contracts by week last year…the green line is this year…and the blue line is the 15 year average for each week.
Follow the green line below.
Using a median gives you the middle point of the data that is less likely to be skewed, Most experts believe it is best for tracking data Longterm.
PRICE PER SQFT
While the median sales price is remaining in a tight band, The Average Sold Dollar per sqft remains at an all-time high, well above one year ago, indicating that consumers are getting a smaller house for the money and that homes are continuing to appreciate despite a stable median Sale Price
INVENTORY
2,113 New listings came on the market in June 2024 which is a 6.1 % increase over June of 2023 and year to date, there is a16.6% increase of new listings over 2023.
Active Inventory stands at approximately 3,800 listings in mid July.
While this level of inventory is a significant increase over the 1,035 listing “floor” that we set in February of 2022, we still need roughly 4,300 additional listings market wide to achieve a balanced market (5 months of inventory)
The gap between the number of listings available for sale and the number of listings needed to maintain a balanced market is substantial. see chart below.
NEW CONSTRUCTION SALES
New construction represents 42% of all pending contracts in the MLS and new construction comprises about 38% of the closings.
DISTRESSED PROPERTIES
Foreclosures and Short Sales continue to hold at a combined 0.9% of all available listings currently. They are still at extremely low levels.
OVER-MILLION MARKET
We are at roughly double the monthly pre-pandemic sales levels of $1MM+ properties. This market segment remains surprisingly robust.
These statistics reflect the entire Charleston Metro area, but real estate is hyper-local and can vary by area and neighborhood. If you would like information about your neighborhood and home, please don’t hesitate to contact me!