Category Archives: Real Estate (Market info)

This Category features Charleston area market data and information

Market Review – Charleston Area MLS -January Update 2026

CLOSED SALES – There were1,501 closed sales in December of 2025, up 4.6% from December of of 2025

SALES PRICE – The median sales price closed out at $433,825| up+4.6% year-over-year, and the average sales price for November 2025 was$630,469 up+3.0%

PRICE PER SQFT – The average price per sqft for all residential property types was at $295 | up +1.4%
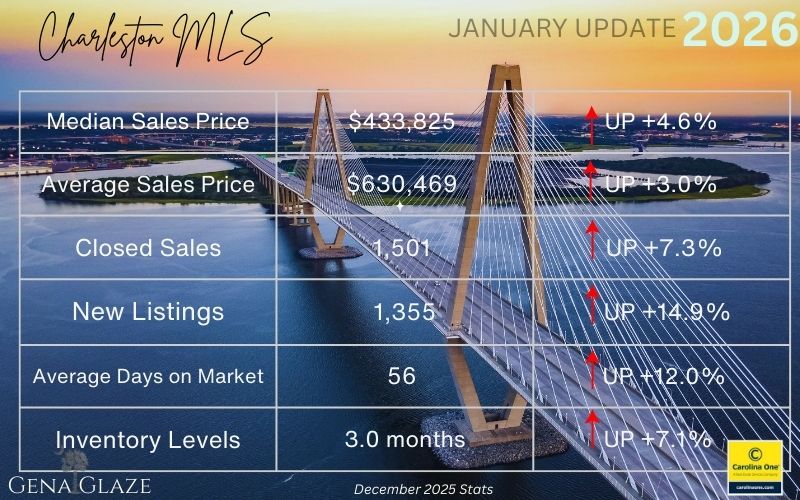
NEW WRITTEN SALES (Pending) – There were 1,181 new written sales in December 2025, up+16.2% This is an indicator of future activity and seems to be a good sign for 2026.

INVENTORY – Approximately 1,355 new listings (all property types) came online in December of 2025, which is upc+14.4% with the average Days on Market at 56, up +12% and 3.0 months of inventory.

NEW CONSTRUCTION

new construction comprises about 34% of the closed sales and represents 37% of all pending contracts in the MLS

  • New Homes “pendings” will always be higher than new homes closings as new construction typically sits in pending status for far longer than a resale, and the new homes tend to “pile up” in pending status, so new homes actually represent about 34% of the sales market currently
  • New homes represent 24% of the available inventory currently
  • 14% of all closings in Charleston County are new construction
  • 38% of all closings in Dorchester County are new construction
  • 53% of all closings in Berkeley County are new construction

DECEMBER MEDIAN SALES PRICE BY COUNTY:
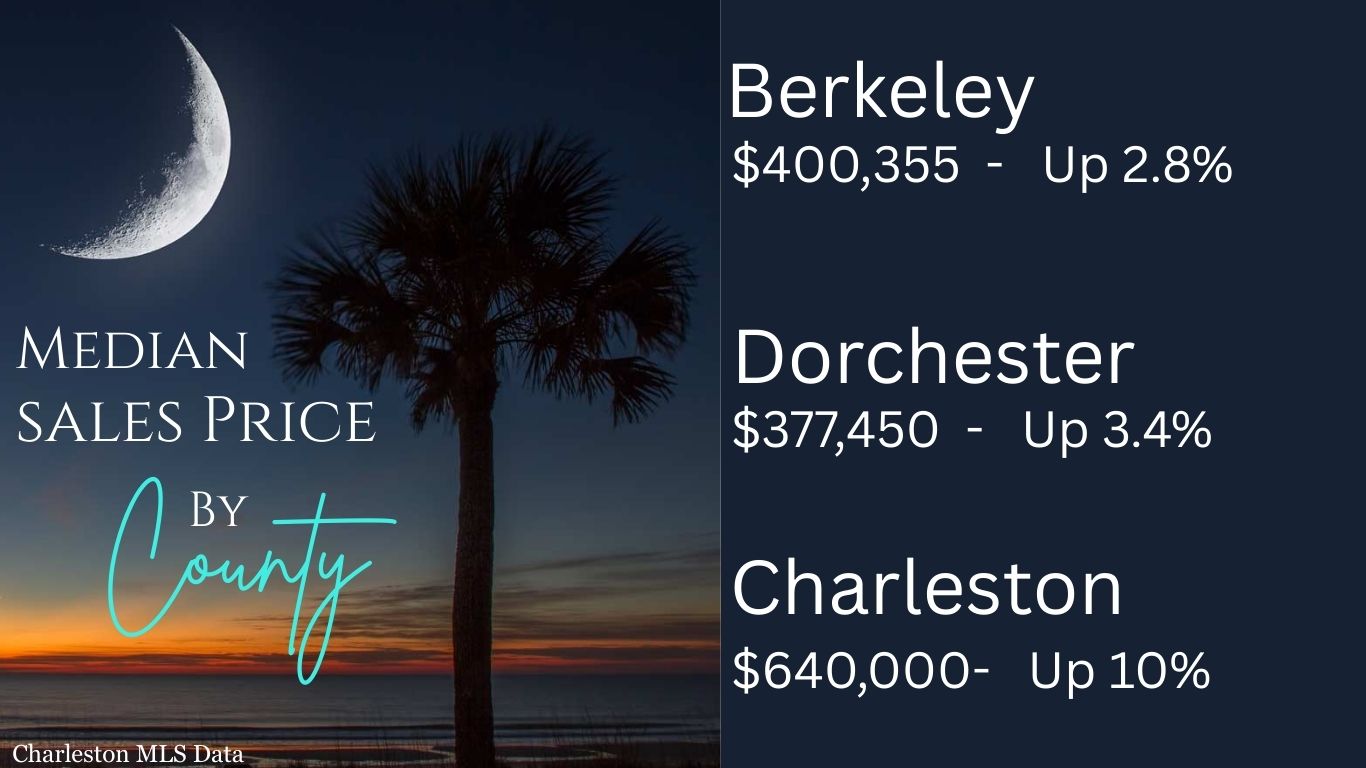
Year over Year – 2024 VS 2025

Nationally– Year Over Year – There was 3.0% decrease in pending home sales according to the National Association of Realtors. Regionally, there were gains in in the South and declines in the Northeast, Midwest, and West

Charleston MLS – 2025 Closed sales were at approximately 5,000 which was about the same as they were in 2024. New listing total for the year came in at 6,012, up just 1% from 2024 and the median sales price was up just 1.3 %.

The Takeaway: December 2025 saw some increases in closed sales, price, and inventory compared to December 2024, but the year-over-year comparison (2024/2025) was relatively flat, with 2025 statistics very similar to those of 2024. However, December 2025 experienced an impressive 16% increase in Pending Sales (new written sales/not closed), which is an indicator of future closed sales and could be a positive sign for 2026.
Gena Glaze

Leave a comment

Filed under Charleston SC Market Stats, Market Statistics, Real Estate (Market info)

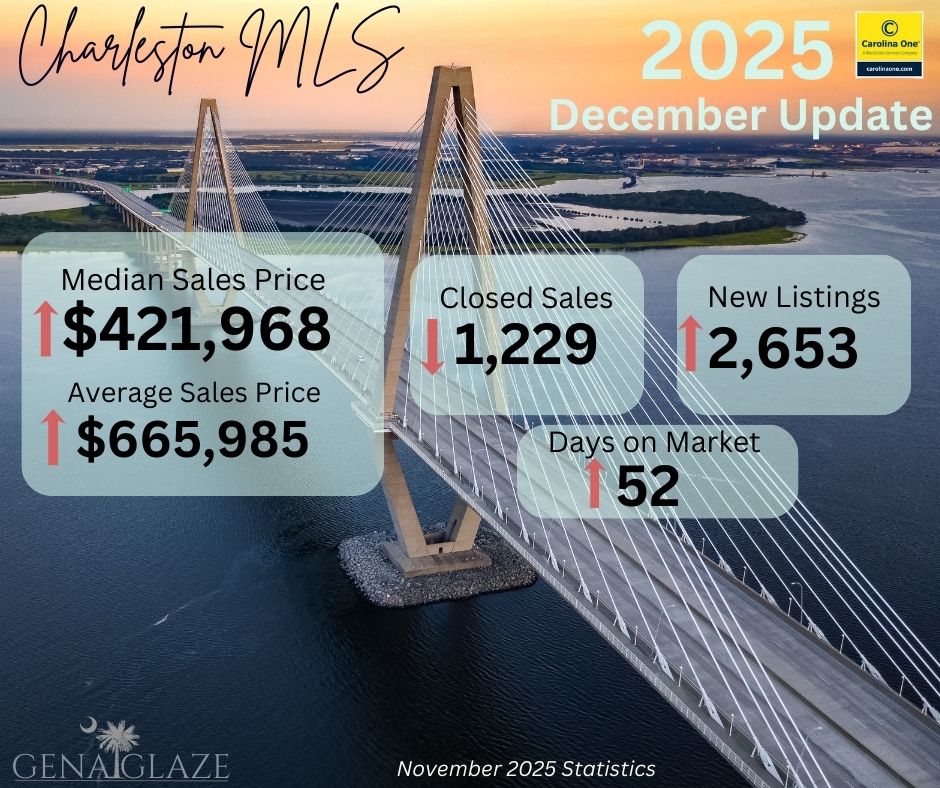
Market Review – Charleston Area MLS – December Update 2025

CLOSED SALES – There were1,229 closed sales in November of 2025, down-7.8% from November of 2024.

SALES PRICE – The median sales price closed out at $421,968 | up+0.6% year-over-year, and the average sales price for November 2025 was$665,985 | up+8.8%

PRICE PER SQFT – The average price per sqft for all residential property types was at $228 | up +3.2%

NEW WRITTEN SALES (Pending) – There were 1,286 new written sales in November 2025, up+4.0%

INVENTORY – Approximately 2,653 new listings (all property types) came online in November of 2025, which is up+4.4% with the average Days on Market at 52, up +8.3% and 3.5 months of inventory.

NEW CONSTRUCTION

  • New homes represent 28% of closed sales, which is down approximately 26%

The Takeaway: Closed sales dipped slightly, but with mortgage rates easing, more buyers are jumping back in, as seen in the rise in loan applications and new sales contracts. New listings climbed about 4%, adding to inventory and lengthening days on market, though we’re still short of the supply needed for a balanced market.

OCTOBER MEDIAN SALES PRICE BY COUNTY:

Berkeley $380,000 | down-4.0%

Dorchester $385,000 | up+4.1%

Charleston $636,000 | down-2.2%

Gena Glaze

Leave a comment

Filed under Charleston SC Market Stats, Market Statistics, Real Estate (Market info)

Market Review – Charleston Area MLS – November Update 2025

CLOSED SALES – There were1,379 closed sales in October of 2025, up 0.9% from October of 2024.

SALES PRICE – The median sales price closed out at $425,885 | up+2.0% year-over-year, and the average sales price for October 2025 was$653,949 | up +1.3%

PRICE PER SQFT – The average price per sqft for all residential property types was at $292, down -3.3%

NEW WRITTEN SALES (Pending) – There were 1,580 new written sales in October 2025, up +2%

INVENTORY – Approximately 2,134 | listings (all property types) came online in October of 2025, which is up+8.5% and the average Days on Market was at 54, up +22.7% with 3.2 months of inventory.

NEW CONSTRUCTION

  • New homes represent 37% of closed sales
  • 18% of all closings in Charleston County were new construction
  • 35% of all closings in Dorchester County were new construction
  • 53% of all closings in Berkeley County were new construction

OCTOBER MEDIAN SALES PRICE BY COUNTY:

Berkeley $402,900 | up +6.0%

Dorchester $370,000 | up +1.3%

Charleston $685,000 | up+11.4%

Gena Glaze

Leave a comment

Filed under Charleston SC Market Stats, Market Statistics, Real Estate (Market info)

Market Review – Charleston Area MLS – October Update 2025

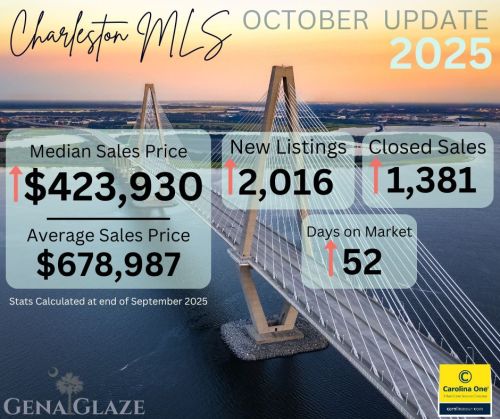
CLOSED SALES – There were 1,381 closed sales in September of 2025, up 8.9% from September of 2024.

PRICE PER SQFT – The average price per sqft for all residential property types was at $296,up 0.7%

SALES PRICE – The median sales price closed out at $423,930 in September 2025, up+3.4% over September of 2024 and the average sales price for August 2025 was $$634,965 The median sales price is still holding steady. It has been in a tight band between 400k and 425K most of the last 3 years.

NEW WRITTEN SALES (Pending) – There were 1,355 new written sales in September 2025, up 0.8% versus September 2024.

INVENTORY – Approximately 2,016 new listings (all property types) came online in September of 2025, which is up 0.1% from September 2024 and the average Days on Market was at 52 (up 20.9%) with 3.7 months of inventory

NEW CONSTRUCTION

  • New homes represent 23% of the available inventory
  • 18% of all closings in Charleston County were new construction
  • 35% of all closings in Dorchester County were new construction
  • 53% of all closings in Berkeley County were new construction

SEPTEMBER MEDIAN SALES PRICE BY COUNTY:

Berkeley $399,945 | up +5.3%

Dorchester $385,000 | +4.9%

Charleston $600,000 | -6.3%

Gena Glaze

Leave a comment

Filed under Charleston SC Market Stats, Market Statistics, Real Estate (Market info)

Market Review – Charleston Area MLS – September Update 2025

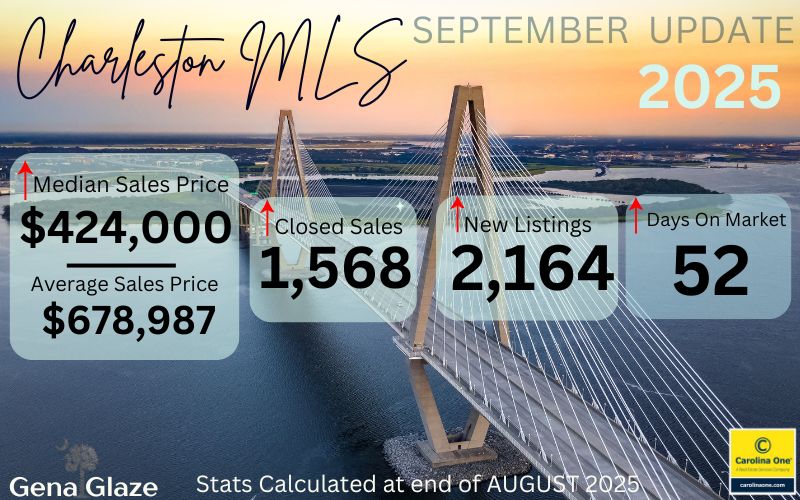
SALES PRICE – The median sales price closed out at $424,000 in August 2025, up+1.2% over August of 2024 and the average sales price for August 2025 was $678,987.

NEW WRITTEN SALES (Pending) – There were 1,568 new written sales in August 2025, up 11.9% versus August 2024. Approximately 480 of these sales were new construction, up+15.7%

CLOSED SALES – There were 1,547 closed sales in August of 2025, up 0.9% from August of 2024. New construction closed sales accounted for 28% of these sales, up +11.6%

INVENTORY – Approximately 2,164 new listings (all property types) came online in August of 2025, which is up +11.1% from August 2024 and the average Days on Market was at 52 (up 23.8%) with 4.1 months of inventory. 581 of August’s new listings were new construction, up 26.3%  Previously owned homes (non-new construction) days on market was up+47.1%.

PRICE PER SQFT – The average price per sqft for all residential property types was at $230, up 3.6%.

SHOWINGS PER LISTING – 3.8 | down -7.3%

AUGUST STATS BY COUNTY:

Berkeley – The median sales price was $399,923 | up +0.2% The average sales price was $466,057 and the average days on market was 54. Closed sales (503) were up 0.6%, year over year, 45% of the closed sales were new construction (up 10%)

Charleston – The median sales price was $675,000 | up +12.5%. The average sales price was $1,031,255 and the average days on market was 49 | up+48.5%. Closed sales (652) | up +2.5% New Construction represented 12 % of these sales (up 65.2%).

Dorchester – The median sales price was $372,500 | up +0.5%. The average sales price was $385,433  and the average days on market was 41 | up +32.3%. Closed sales (317) were down -11.7%. New Construction represented 40% of the closed sales.

Gena Glaze

Leave a comment

Filed under Charleston SC Market Stats, Market Statistics, Real Estate (Market info)

Median Sales Price Vs Average Sales Price

The average sale price is determined by totaling all the sale prices of homes sold in a specific area over a set time period and dividing by the number of properties sold. However, if a property or two sells at an unusually high or low price, it can distort the average, making it an unreliable metric in certain situations.
The median sale price is the price right in the middle of a dataset. It shows the point where half the properties in an area sell for more and the other half sell for less. This figure is a reliable way to track market trends over time.

Average and median sales prices are both useful methods for analyzing data, but they serve different purposes.

Gena Glaze

Leave a comment

Filed under Home Buying (For Buyers), Learn Real Estate Terms, Real Estate (Market info)

Market Review – Charleston Area MLS – August Update 2025

Entire Charleston MLS (July Stats):

SALES PRICE – The median sales price closed out at $430,000 in July 2025, up +1.2% over July of 2024 and the average sales price for July 2025 was $620,556 

NEW WRITTEN SALES (Pending) – There were 1,577 new written sales in July 2025, up 11% versus July 2024.

CLOSED SALES – There were 1,719 closed sales in July of 2025, up 7.4% from July of 2024.

INVENTORY – Approximately 2,290 new listings (all property types) came online in July 2025, which is up +5% from July 2024 and the average Days on Market was at 45 with 3.6 months of inventory (up 16%). 1712 of July’s new listings were existing homes (non-new construction) this category is at 3.9 months of inventory, up 30%

PRICE PER SQFT – The average price per sqft for all residential property types was at $289 but for resales (non-new construction) it was calculated at $311 / sqft.  Despite a fairly stable Median Sale Price, this increase in price per sqft suggests consumers are getting a smaller house for the money (higher Sold $/sqft).

New Construction – New construction represents about 36% of the closings in MLS. In Berkeley County new construction represents 56% of all closed sales.

JULY STATS BY COUNTY:

Berkeley – The median sales price was $395,000 | down -0.3%. The average sales price was $500,965 and the average days on market was 45 | up +21.6%

Charleston – The median sales price was $623,225 | down -1.7%The average sales price was $870,712 and the average days on market was 39 | up +25.8%

Dorchester – The median sales price was $389,500 | up +2.3%. The average sales price was $417,491 and the average days on market was 42 | up +20%

JULY STATS – QUICK VIEW OF MUNICIPLAITIES:

Goose Creek– The median sales price was $314,900 | down -4.3% The average sales price was $317,088 |

Hanahan – The median sales price was $365,000 | down -1.3%, The average sales price was $431,131 

Summerville – The median sales price was $399,990 | no change 0.0%, The average sales price $431,092

North Charleston – The median sales price was $346,450 | down -0.4% The average sales price was $392,508 

Charleston / West Ashley – The median sales price was $585,000 | down -8.5% The average sales price was $875,381 

Mount Pleasant -The median sales price was $955,000 | up +9.1%, The average sales price was $1,127,187 

Daniel Island -The median sales price was $1,600,000 | up +7.4% The average sales price was $1,314,444 

James Island The median sales price was $338,000 | down -47.6%, The average sales price was $338,000 

Gena Glaze

Leave a comment

Filed under Charleston SC Market Stats, Market Statistics, Real Estate (Market info)

Market Review – Charleston Area MLS – MAY Update 2025

Review for Entire Charleston MLS (April Stats):

SALES PRICE – The median sales price closed out at $440,000 in April 2025, up +4% over April of 2024 and the average sales price for April 2024 was $664,971.

NEW WRITTEN SALES (Pending) – There were 1,876 new written sales in April 2025, up 10.5% versus April of 2024.

CLOSED SALES – There were 1,568 closed sales in April of 2025, down 6.7% from April of 2024.

INVENTORY – Approximately 2,622 new listings came online in April 2025, which is up +15.7% from April 2024 and the average Days on Market was at 48, up +23.1% with 3.3 months of inventory (up 26.9%).

PRICE PER SQFT – The median price per sqft closed out at $237 for April of 2025, up 4.9 % and an average of $307 sqft.

APRIL STATS BY COUNTY:

Berkeley – The median sales price was $395,000 | down -1.0%. The average sales price was $508,250 and the average days on market was 52 | up +20.9%

Charleston – The median sales price was $600,000 | down -5.5%. The average sales price was $913,859 and the average days on market was 39 | up +25.8%

Dorchester – The median sales price was $370,000 | 0.0% (no change year over year). The average sales price was $413,610 and the average days on market was 48 | up +29.7%

Gena Glaze

Leave a comment

Filed under Real Estate (Market info)

Market Review – Charleston Area MLS-APRIL Update 2025

NEW SALES – Pending – There were 1,898 new written sales in March 2025, up 7.1% versus March of 2024. This is a good indicator of future closed sales.

CLOSED SALES – There were 1,520 closed sales in March of 2025, down 1.1% from March of 2024

SALES PRICE – The Median sales price closed out at $429,000 in March 2025, up +4.6% over March of 2024 and the average sales price for March 2024 was $666,861, up+11.3%.

INVENTORY – Approximately 2,463 new listings came online in March 2025, which is up +13.2% from March 2024 and the average Days on Market was at 52, up +40.5% from March of 2024 with 3.1 months of inventory (up 24%).

PRICE PER SQFT – The median price per sqft closed out a $240 for March of 2025, up 5.7 % from March of 2024. The average of $309, rose +5.5%.

By County:

Berkeley – Median Price per sqft =$203 | up +2.5%, Average price per sqft $232 | up +2.7%

Charleston – Median Price per sqft =$353 | up +8.3%, Average price per sqft $420 | up+4.7%

Dorchester – Median Price per sqft = $198 | up +7.6%, Average price per sqft $201 | up +5.2%

Gena Glaze

Leave a comment

Filed under Market Statistics, Real Estate (Market info)

Lowcountry Lowline is Officially Launching It’s First Phase

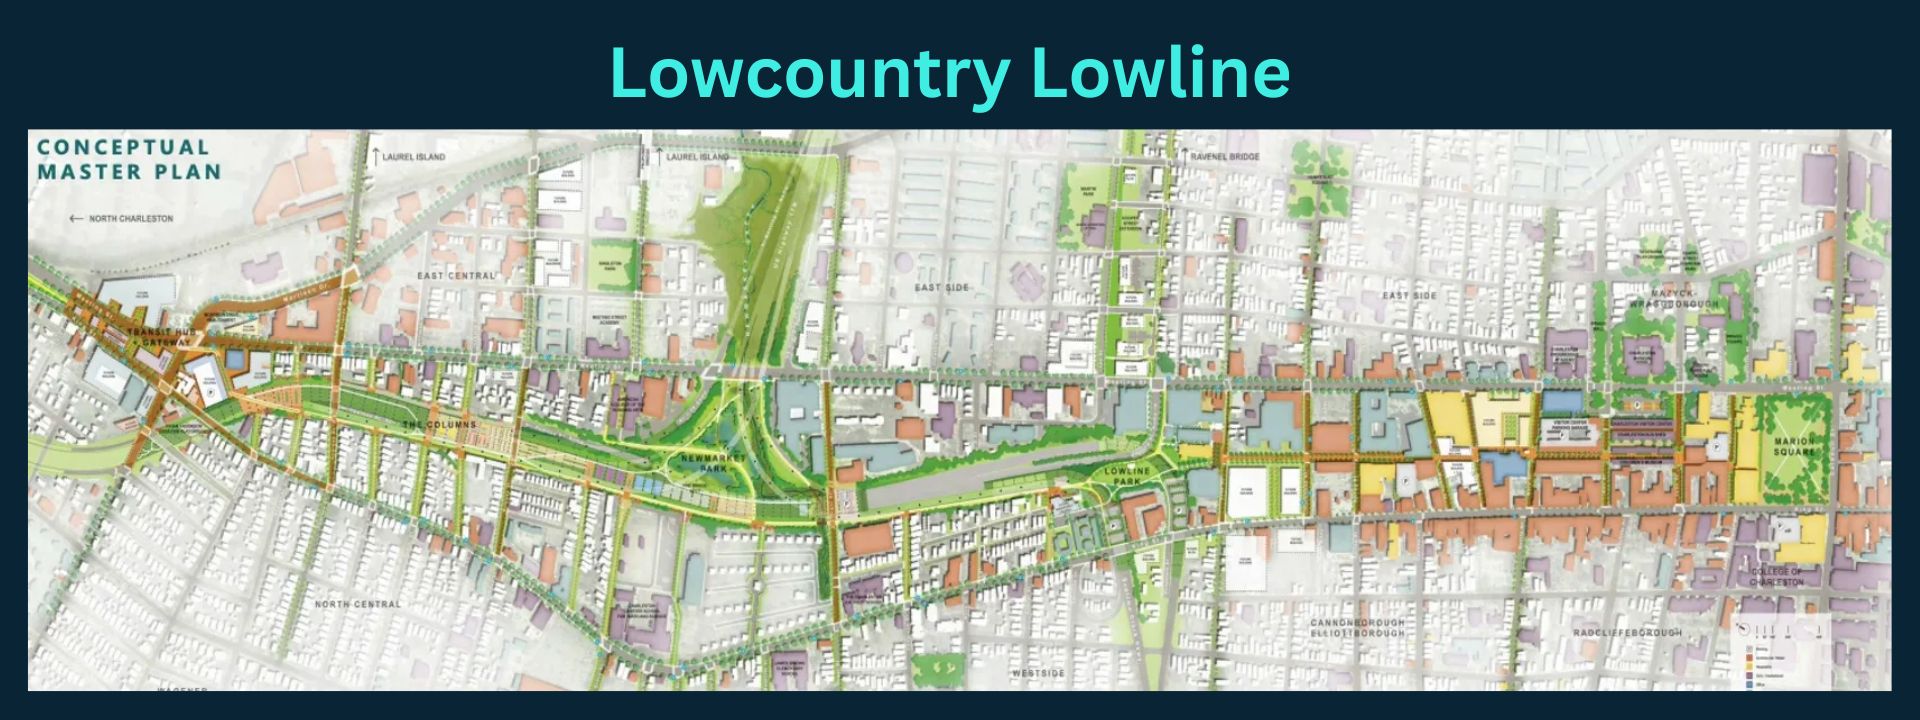
The Lowline project envisions a central spine of parks and mobility systems connecting downtown to West Ashley, North Charleston and Mt Pleasant. The plan will transform an abandoned rail line and neglected highway corridor into a continuous green corridor that supports the surrounding communities and provides places for active and passive recreation.. 

Charleston City Council recently approved a $1.1 million design-build contract, officially launching the first phase of construction for this long-awaited project. A community open house is scheduled for Thursday, April 24th from 5:00 to 6:30 p.m. at Palmetto Brewing Company, located at 289 Huger Street in Charleston.

THE NORTH CENTRAL CORRIDOR:

  • The North Central Corridor runs from Romney Street to the planned transit hub on Mount Pleasant Street
  • The North Central Corridor provides areas for active and passive recreation in “The Columns” beneath the elevated highway
  • “The Columns” area also provide ample space to host a neighborhood market
  • This district will include pocket parks where neighborhood streets end into the Lowline property
  • The potential transit oriented redevelopment of the Parks Department building provides an opportunity to create a new pedestrian district at the North end of the Lowline

THE PARKS

  • The Parks District runs from Romney Street to Line Street
  • It is bookended by two new park spaces: New Market Creek Park to the North and Lowline Park to the South
  • Lowline Park is a large open space designed for events and gatherings
  • NewMarket Park is an enhanced Salt- and Fresh- water ecosystem
  • NewMarket Park provides a natural amenity for the public to enjoy while also enhancing stormwater management for the surrounding neighborhoods

THE URBAN CORE

  • The Urban Core District of the Lowline runs from Line Street to Marion Square
  • The District currently has the most diverse mix of uses and the highest density on the peninsula
  • The Lowline in the Urban Core is envisioned to be a series of alleys
  • Some portions of the Lowline already exist as alleys between Mary and Hutson Street
  • The side streets that connect King and Meeting streets will become important access points. Improvements to these connecting streets will be included in the Lowline
  • This Network of interconnected pedestrian walkways will enhance the entire district

Read More at Lowcountry Lowline

Gena Glaze

Leave a comment

Filed under Charleston Area Growth and Development, Places, Real Estate (Market info)