Category Archives: Mortgage Info

This category features posts news and information that relate to home mortgages, interest rates and buying a home.

Are Lower Rates Causing Demand to increase? Mortgage Applications Rose to Their Highest Level in Six Weeks

Mortgage rates dropped significantly in the last few weeks.

The 30-year, fixed mortgage rate averaged 7.29% for the week ending Nov. 22, according to Freddie Mac‘s Primary Mortgage Market Survey. That’s down significantly from last week’s 7.44% and up from 6.58% the same week a year ago. 

HousingWire’s Mortgage Rates Center showed Optimal Blue’s average 30-year fixed rate on conventional loans at 7.283% on Wednesday.

Mortgage applications rose to their highest level in six weeks after the 30-year fixed mortgage rate fell last week.

Total home loan applications increased 3% for the week ending Nov. 17 compared to the previous week, according to data from the Mortgage Bankers Association (MBA).

Mortgage rates for the 30-year fixed loan averaged 7.44%, falling 6 basis points in one week, according to Freddie Mac‘s Primary Mortgage Market Survey. 

On a seasonally adjusted basis, purchase applications rose by nearly 4% over the week, with increases in both conventional and government purchase loan demand.

The average loan size on a purchase application was $403,600, the lowest since January 2023. Joel Kan, MBA’s vice president and deputy chief economist, said this corroborates with other sources of home-sales data pointing to a rising share of first-time homebuyers entering the market.

Meanwhile, refinance applications rose slightly by 1.6% last week but remained subdued. The adjustable-rate mortgage (ARM) share of activity fell to 8.3% of total applications, down from 8.8% the previous week.

The share of Federal Housing Administration (FHA) loan activity increased to 14.8% of all applications, down from 14.4% the week prior. The share of Department of Veterans Affairs (VA) loan activity was 11.3%, up from 11.2% over the previous week, while the share of U.S. Department of Agriculture (USDA) loan activity fell to 0.4% from 0.5% week over week.

Gena Glaze

Stats reported from Housing Wire

Leave a comment

Filed under Home Buying (For Buyers), Mortgage Info, Real Estate (Market info)

Mortgage Rates Plunge Below 8%—To Lowest Level Since September

After already falling for two days, 30-year mortgage rates plummeted Thursday, shedding another two-tenths of a point. That drops the 30-year average to 7.92%, its cheapest level since September. Rates were down by double-digit basis points for almost every other loan type as well.

Since rates vary widely across lenders, it’s always smart to shop around for and compare rates regularly, no matter what type of loan you’re seeking.

Loan TypeNew PurchaseRefinance
30-Year Fixed7.92%8.20%
FHA 30-Year Fixed7.66%7.96%
Jumbo 30-Year Fixed7.19%7.19%
15-Year Fixed7.28%7.45%
5/6 ARM7.79%7.87%

MSN

Gena Glaze

Leave a comment

Filed under Home Buying (For Buyers), Mortgage Info

Charleston Real Estate -Market Update – 9-18-23

Here is what is worth knowing today:

(1) Written sales market wide finished 13% less in August of ’23 versus August of ’22.

  • It was anticipated that sales would be -15% for the year (versus 2022) with the first half of the year being much worse than -15% and the back half of the year being better than -15%
  • Based on interest rates remaining stubbornly and persistently high, we are now anticipating that the second half of the year will be similar to the first half of the year with sales in the -15% year-over-year range

(2) Last week saw 239 properties go under contract, a very “normal” number for this time of year but far below the “juiced up” pandemic years of 2020 and 2021. Sales (green line) have remained remarkably close to the 15 year average (blue line) for about three and a half months.

The orange line represents ratified contracts by week last year…the green line is this year…and the blue line is the 15 year average for each week.

(3)  Mortgage rates remaining elevated is holding back sales.

https://fred.stlouisfed.org/series/MORTGAGE30US

4)  The Median sale price in the Charleston market continues to stay in a tight band between $400k and $420k where it has been for most of the last 16 months.

(5) Active Inventory stands at 2,510 listings. We haven’t seen much inventory growth this summer and inventory typically starts a slow seasonal decline in September or October. It is believed this may likely put upward pressure on prices, or at the very least hold prices steady.

While this level of inventory is a significant increase over the 1,035 listing “floor” that we set in February of 2022:

  • Roughly an additional 5,500 listings is needed market wide to achieve a balanced market (5 months of inventory)
  • The gap between the number of listings available for sale and the number of listings needed to maintain a balanced market is substantial. The chart below is an attempt to express this visually.

(6) The number of new listings taken in August was even with the same month a year prior for the first time in two years, but inventory still remains low.

7) The Charleston market has about six or seven weeks of inventory as a whole, still solidly a seller’s market (this can vary by price range and specific location). The most active areas have inventory levels in the 3-6 week range.

(8) New construction represents 46% of all pending contracts in the MLS and new construction comprises about 32% of the closings.

  • New Homes “pendings” will always be higher than new homes closings as new construction typically sits in pending status for far longer than a resale, and the new homes tend to “pile up” in pending status, so new homes actually represent about 32% of the sales market currently
  • New homes represent 33% of the available inventory, currently.

(9) Foreclosures and Short Sales continue to hold at a combined .6% of all available listings currently. This is down from 1.8% of all available listings on 1/1/2020. This market has very few “newly distressed” properties in the pipeline.

  • “Serious delinquencies fell to the lowest level since August 2006; the July delinquency rate was negligibly higher than the lowest level ever recorded.” – Black Knight Mortgage Monitor statement from two weeks ago.
  • Record home equity is driving the low delinquency rate along with high levels of employment.

(10) We are at roughly double the monthly pre-pandemic sales levels of $1MM+ properties. This market segment remains surprisingly robust.

Leave a comment

Filed under Home Buying (For Buyers), Mortgage Info, Real Estate (Market info)

Why There Won’t Be a Flood of Foreclosures Coming to the Housing Market

With the rapid shift that’s happened in the housing market this year, some people are raising concerns that we’re destined for a repeat of the crash we saw in 2008. But in truth, there are many key differences between what’s happening today and the bubble in the early 2000s.

One of the reasons this isn’t like the last time is the number of foreclosures in the market is much lower now. Here’s a look at why there won’t be a wave of foreclosures flooding the market.

Not as Many Homeowners Are in Trouble This Time

After the last housing crash, over nine million households lost their homes due to a foreclosure, short sale, or because they gave it back to the bank. This was, in large part, because of more relaxed lending standards where people could take out mortgages they ultimately couldn’t afford. Those lending practices led to a wave of distressed properties which made their way into the market and caused home values to plummet.

But today, revised lending standards have led to more qualified buyers. As a result, there are fewer homeowners who are behind on their mortgages. As Marina Walsh, Vice President of Industry Analysis at the Mortgage Bankers Association (MBA), says:

For the second quarter in a row, the mortgage delinquency rate fell to its lowest level since MBA’s survey began in 1979 – declining to 3.45%. Foreclosure starts and loans in the process of foreclosure also dropped in the third quarter to levels further below their historical averages.”

There Have Been Fewer Foreclosures over the Last Two Years

While you may have seen recent stories about the number of foreclosures rising today, context is important. During the pandemic, many homeowners were able to pause their mortgage payments using the forbearance program. The program gave homeowners facing difficulties extra time to get their finances in order and, in many cases, work out a plan with their lender.

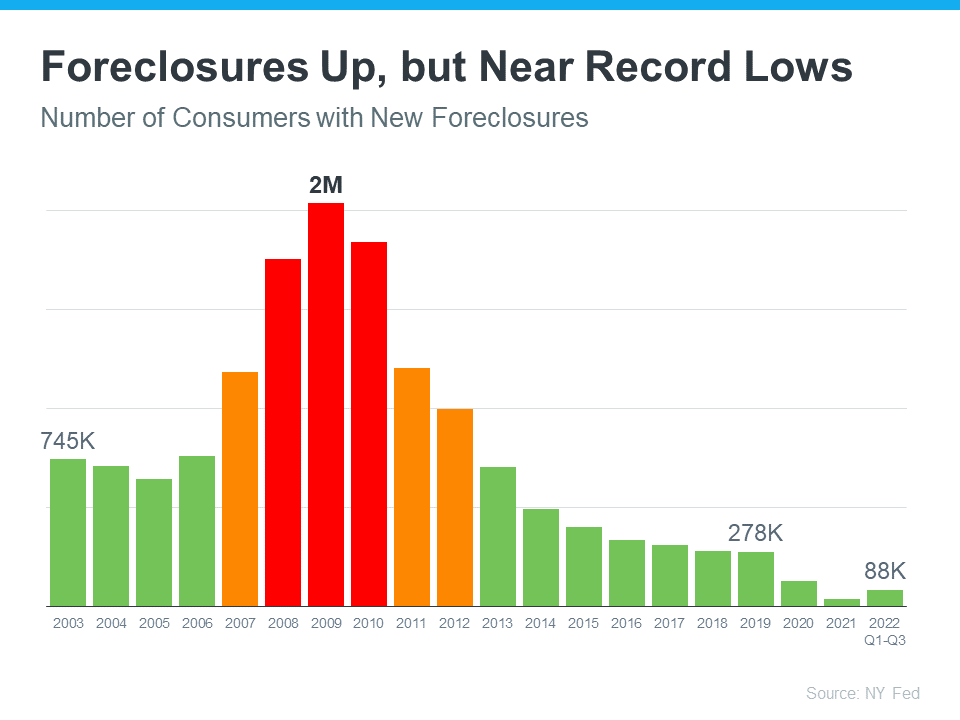
With that program, many were concerned it would result in a wave of foreclosures coming to the market. That fear didn’t materialize. Data from the New York Fed shows there are still fewer foreclosures happening today than before the pandemic (see graph below):

Why There Won’t Be a Flood of Foreclosures Coming to the Housing Market | Simplifying The Market

That means, while there are more foreclosures now compared to last year (when foreclosures were paused), the number is still well below what the housing market has seen in a more typical year, like 2017-2019.

And most importantly, the number we’re seeing now is still far below the number we saw during the market crash (shown in the red bars in the graph). The big takeaway? Don’t let a headline in the news mislead you. While foreclosures are up year-over-year, historical context is essential to understanding the full picture.

Most Homeowners Have More Than Enough Equity To Sell Their Homes

Many homeowners today have enough equity to sell their homes instead of facing foreclosure. Due to rapidly rising home prices over the last two years, the average homeowner has gained record amounts of equity in their home. And if they’ve stayed in their homes even longer, they may have even more equity than they realize. As Ksenia Potapov, Economist at First Americansays:

Homeowners have very high levels of tappable home equity today, providing a cushion to withstand potential price declines, but also preventing housing distress from turning into a foreclosure. . . the result will likely be more of a foreclosure ‘trickle’ than a ‘tsunami.’”

A recent report from ATTOM Data explains it by going even deeper into the numbers:

“Only about 214,800 homeowners were facing possible foreclosure in the second quarter of 2022, or just four-tenths of one percent of the 58.2 million outstanding mortgages in the U.S. Of those facing foreclosure, about 195,400, or 91 percent, had at least some equity built up in their homes.”

Bottom Line

If you see headlines about the increasing number of foreclosures today, remember context is important. While it’s true the number of foreclosures is higher now than it was last year, foreclosures are still well below pre-pandemic years. If you have questions, let’s connect.

Gena Glaze

gena@genaglaze.com

843-343-8239

Leave a comment

Filed under Home Buying (For Buyers), Mortgage Info, Real Estate (Market info)

How Inflation Affects Mortgage Rates

When you read about the housing market in the news, you might see something about a recent decision made by the Federal Reserve (the Fed). But how does this decision affect you and your plans to buy a home? Here’s what you need to know.

The Fed is trying hard to reduce inflation. And even though there’s been 12 straight months where inflation has cooled (see graph below), the most recent data shows it’s still higher than the Fed’s target of 2%: 

While you may have been hoping the Fed would stop their hikes since they’re making progress on their goal of bringing down inflation, they don’t want to stop too soon, and risk inflation climbing back up as a result. Because of this, the Fed decided to increase the Federal Funds Rate again last week. As Jerome Powell, Chairman of the Fed, says:

We remain committed to bringing inflation back to our 2 percent goal and to keeping longer-term inflation expectations well anchored.”

Greg McBride, Senior VP, and Chief Financial Analyst at Bankrateexplains how high inflation and a strong economy play into the Fed’s recent decision:

Inflation remains stubbornly high. The economy has been remarkably resilient, the labor market is still robust, but that may be contributing to the stubbornly high inflation. So, Fed has to pump the brakes a bit more.”

Even though a Federal Fund Rate hike by the Fed doesn’t directly dictate what happens with mortgage rates, it does have an impact. As a recent article from Fortune says:

“The federal funds rate is an interest rate that banks charge other banks when they lend one another money . . . When inflation is running high, the Fed will increase rates to increase the cost of borrowing and slow down the economy. When it’s too low, they’ll lower rates to stimulate the economy and get things moving again.”

How All of This Affects You 

In the simplest sense, when inflation is high, mortgage rates are also high. But, if the Fed succeeds in bringing down inflation, it could ultimately lead to lower mortgage rates, making it more affordable for you to buy a home.

This graph helps illustrate that point by showing that when inflation decreases, mortgage rates typically go down, too (see graph below): 

As the data above shows, inflation (shown in the blue trend line) is slowly coming down and, based on historical trends, mortgage rates (shown in the green trend line) are likely to follow. McBride says this about the future of mortgage rates:

“With the backdrop of easing inflation pressures, we should see more consistent declines in mortgage rates as the year progresses, particularly if the economy and labor market slow noticeably.”

Bottom Line

What happens to mortgage rates depends on inflation. If inflation cools down, mortgage rates should go down too. Let’s talk so you can get expert advice on housing market changes and what they mean for you.

Leave a comment

Filed under Mortgage Info

Investing; Americans Choose Real Estate!

Americans Choose Real Estate as the Best Investment [INFOGRAPHIC] | Keeping Current Matters

Leave a comment

01/29/2022 · 1:05 pm

TEN STEPS TO BUYING A HOME Charleston SC Real estate / Gena Glaze

20190329-10-Steps-KCM

Leave a comment

04/23/2019 · 10:50 am

A look at rates -70’s – Today!


Leave a comment

Filed under Mortgage Info, Real Estate (Market info)

Homes More Affordable Today Than 1985-2000


Rising home prices have many concerned that the average family will no longer be able to afford the most precious piece of the American Dream – their own home.

However, it is not just the price of a home that determines its affordability. The monthly cost of a home is determined by the price and the interest rate on the mortgage used to purchase it.

Today, mortgage interest rates stand at about 4.5%. The average annual mortgage interest rate from 1985 to 2000 was almost double that number, at 8.92%. When comparing affordability of homeownership over the decades, we must also realize that incomes have increased.

This is why most indexes use the percentage of median income required to make monthly mortgage payments on a typical home as the point of comparison.

Zillow recently released a report comparing home affordability over the decades using this formula. The report revealed that, though homes are less affordable this year than last year, they are more affordable today (17.1%) than they were between 1985-2000 (21%). Additionally, homes are more affordable now than at the peak of the housing bubble in 2006 (25.4%). Here is a chart of these findings:

Homes More Affordable Today than 1985-2000 | Keeping Current Matters

What will happen when mortgage interest rates rise?

Most experts think that the mortgage interest rate will increase to about 5% by year’s end. How will that impact affordability? Zillow also covered this in their report:

Homes More Affordable Today than 1985-2000 | Keeping Current Matters

Rates would need to approach 6% before homes became less affordable than they had been historically.

Bottom Line

Though homes are less affordable today than they were last year, they are still a great purchase while interest rates are below the 6% mark.

Gena Glaze


Leave a comment

Filed under Home Buying (For Buyers), Mortgage Info, Real Estate (Market info)

Should I Wait Until Next Year To Buy? Or Buy Now?

Gena Glaze

Leave a comment

Filed under Mortgage Info, Real Estate (Market info)